Is El Niño AWOL?
Is El Niño missing? What happened to the rainfall I was promised? What is going on? Some quick answers for those who don't want to read it all (but then you’ll miss the graphical awesomeness I coded up with an assist from climate.gov staff. So read to the end. Please.):
I. No. It’s still here. Based on measurements of sea surface temperature in the tropical Pacific Ocean, this El Niño is the biggest event we’ve seen in almost twenty years.
II. NOAA CPC climate forecasters don’t promise precipitation. For some regions of the U.S., we provide seasonal outlooks for an increased chance of precipitation over a span of a 3-month (seasonal) average.
III. I really don’t know. I ask myself this all the time (particularly during election years).
Here, I’m going to present some recent observations and show how they compare to a typical El Niño pattern. Hopefully you’ll walk away with a couple impressions. The maps below are of the atmospheric flow (1) and precipitation anomalies, or departures, from the December & January average during El Niño (2). Keep in mind no single year ever perfectly matches the “normal” El Niño pattern (3). But how well is the pattern matching up so far this winter?
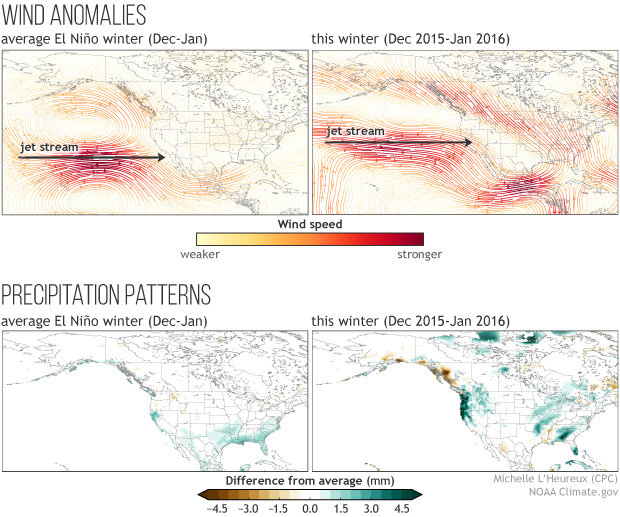
(Top left) Reconstruction of El Niño wind anomalies during December and January. (Top right) The average wind anomaly from December 2015 and January 2016. (bottom left) Reconstruction of El Niño precipitation anomalies during December and January. (Bottom right) The average precipitation anomaly from December 2015 and January 2016. The 250mb winds are from the NCEP/NCAR Reanalysis. Precipitation is from the CPC Unified precipitation (Chen et al., 2008). The dataset is station based, so areas with sparse observing networks will not show anomalies or will show a roughly concentric anomaly around a station (this is the case over large regions of Canada). Anomalies are calculated by subtracting the 1981-2010 monthly averages. Image by Michelle L’Heureux and NOAA Climate.gov.
The warmth in the tropical Pacific related to El Niño fuels a more southward-shifted, eastward-extended Pacific jet stream. You can see this feature in the upper left panel above, which shows strong, anomalous winds flowing from west-to-east over the North Pacific Ocean. The jet helps to drive moisture and precipitation into California. For the December 2015 and January 2016 average (top right panel), we also can see an eastward expansion of the Pacific jet stream and wetter conditions prevailed over the northern half of California and the Pacific Northwest (Tom also wrote about January’s wet weather).
El Niño is also linked to anomalous winds that extend from Central America to Florida and is linked to increased stormy weather and precipitation over the Gulf Coast and Florida. So far this winter, we see a similar flow pattern with wetter conditions over portions of the Southeast and an uptick in tornadoes over Florida.
Impression #1: Though this year’s impacts do not perfectly mirror the typical pattern, we’re already seeing El Niño’s thumbprints. But he’s like the temperamental kid in art class who can’t quite stay in between the lines with his finger paint. Part of that is because there are other weather and climate patterns, which provide distractions. At a given time, El Niño is never the only influence on the atmosphere, but it is the most predictable, which is why we like to talk about it.
Though the Pacific jet stream is juiced up and roaring this year, it is shifted slightly north of its typical position. Likewise, the wetter-than-average West Coast signal has expanded northward into the Pacific Northwest as well. This brings us to Impression #2: The details matter. Even subtle changes in the overall circulation can result in noticeable impacts. It is difficult to anticipate some of these shifts well in advance (4).
While El Niño is generally best seen in averages across 3-months (seasons), month-to-month variations can be significant (5). Again, there can be other things going on in the atmosphere, which can override El Niño. After all, El Niño doesn’t mean the jet stays locked in the exact same place all winter and spring, just that it tends to return to a particular location more frequently than usual. For example, in the figures below, the jet shifted north during December when it just so happened that we simultaneously saw a very positive Arctic Oscillation (AO) state, which might have contributed to this movement. Then in January, the jet shifted back southward, more closely resembling the typical El Niño pattern.
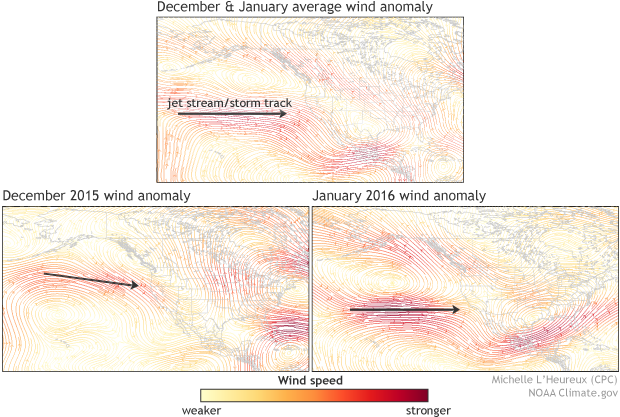
(Top) Wind anomalies based on averaging December 2015 and January 2016. (Middle) The wind anomaly from December 2015. (Bottom) The wind anomaly from January 2016. The 250mb winds are from the NCEP/NCAR Reanalysis. Image by Michelle L’Heureux and NOAA Climate.gov.
These unpredictable details, like the AO, are why CPC climate forecasters provide the odds (probabilities) for certain impacts, and they are never 100% over the U.S. For example, this fall, forecasters indicated there would be a 60% chance of increased precipitation over southern California during the winter due to the knowledge there would be a strong, potentially historic El Niño. A reliable probability forecast means that, for similar outlooks over a long record, 6 out of 10 years should end up wetter and 4 out of 10 years should be near average or drier (click further to learn how to interpret and grade probabilities).
All in all, El Niño is enthusiastically reporting to work, even if its impacts are not identical to the “normal” pattern, and will exert an influence through the spring (March-April-May). It has peaked by most atmospheric and oceanic measures, but it will continue to push the circulation around not only over North America, but also across the globe.
Footnotes
(1) This shows the 250-millibar (mb) winds, which are at the altitude where the pressure is 250mb. Pressure at the surface is roughly 1000mb and the 250mb pressure level is approximately at 6.5 miles above the surface in the mid-latitudes of North America.
(2) Similar to my last blog post, I’m calculating the “reconstruction” using the observed Niño-3.4 SST index values from December 2015 and January 2016. Then I’m averaging together the December and January ENSO reconstruction maps because they’re similar.
(3) To emphasize, we have never ever seen a winter that looks exactly like the “normal” El Niño pattern. Folks (including me!) love collecting past states from history and averaging them up to see what to expect -- and it can be useful summary information -- but it’s also misleading because we know the real world will be somewhat different. Just keep that in mind whenever you see the words “average El Niño pattern” or “El Niño composite.”
(4) General Life Advice: We should always try to get better and make strides to improve. But keep in mind there is a certain amount of uncertainty in climate prediction we’re probably not going to ever remove despite our very best efforts. I can always wear high heels to give me some extra inches, but I’m probably not going to get any taller.
(5) Another reason for the lack of similarity between the El Niño pattern and these 1- and 2-month snapshots is that they are always noisier and more chaotic. This is akin to the idea of how global warming is best seen in the long-term trends over decades, but is harder to see with shorter-term bumps and wiggles. El Niño is generally best seen in seasonal (3-month) averages. Ideally I would have shown you the December-January-February average, but I don’t have the February data yet.
Comments
El Nino
RE: El Nino
RE: RE: El Nino
RE: El Nino
RE: RE: El Nino
By the time the Atlantic hurricane season gets underway, this El Nino is expected to be finished and there is a likelihood that cool-neutral or even La Nina conditions will exist. La Nina tends to increase hurricane activity. But we can't be sure La Nina will develop by August, September and October, the months of climatologically greatest hurricane activity. The greater chance is for the later months. In any case, the influence of ENSO during the fall 2016 season is likely to be in the direction of elevated hurricane activity. We cannot predict which states (such as Florida) would have a land-falling hurricane, but increased general activity implies a somewhat increased likelihood for any of the usual southeastern states receiving one.
Are we going get more rain...
RE: Are we going get more rain...
Assume this is a question about California, maybe ven southern California. There is some indication that the Pacific jet will shift enough to bring some rains to central and southern California in the week 2-4 time frame. Time will tell if these forecasts are correct.
Strong El Niño Patterns
RE: Strong El Niño Patterns
This analysis was done using data only as far back as 1979 and includes all years (not just El Nino years). As to why the difference, that's something that will be closely examined after this episode ends, but the reality is that the circulation associated with any event is likely to at least a little different from other events, as there is always some natural climate variabiabiity in the system.
RE: RE: Strong El Niño Patterns
Feb 17, 2016 Weekly SST Anomaly for Nino 3.4 Region
RE: Feb 17, 2016 Weekly SST Anomaly for Nino 3.4 Region
We'll get a better idea next week as to how the ocean compares to 1998 when the February monthly ERSST data comes in. At this point, we are favoring this event to persist longer into the Spring than the 1997/98 event did. We also judge there to be a 50% chance of La Nina developing by September - November (SON) 2016. For comparison sake, La Nina began in June - August 1998, with the ONI at -1.2 during SON.
RE: RE: Feb 17, 2016 Weekly SST Anomaly for Nino 3.4 Region
Thank You!!!
Weather
lack of rain in february in 2016
El nino
el nino
el nino uncertainty
El nino
Your El Nino Blog
snow for Maine
2-class outlooks
RE: 2-class outlooks
The official CPC seasonal outlooks certainly favored above average precipitation, but the peak probability was about 60%, not 90%. That also meant that that there was about a 33% chance of near average precipitation and a very low chance (but not zero) of below normal preciptation (5-10%).
El Nino
RE: El Nino
sorry make that elevated sea
El Nino
Predictability and height
Southern California Drought and NOAA observations on El Nino
explanation accepted but??
RE: explanation accepted but??
The large scale pattern so far this winter is different from when there was the "ridicoulously resilient ridge" of the past winters. I agree that when we look back at February (just one month), we'll see an anomalous ridge affecting California, but I'm betting this ridge will not be as resilient in the months ahead. This ballgame still has innings left to play.
New World; New El Nino; New Model
El Nino
RE: El Nino
Just to clarify, JPL is part of NASA and not NOAA. Many scientists (not only Bill) are asked by reporters to give their opinion on what may happen, but this doesn't necessarily line up with the seasonal forecasts coming from NOAA CPC. If you want to see the official NOAA outlooks, then I recommend directly consulting this webpage:
http://www.cpc.ncep.noaa.gov/products/predictions/long_range/
The CPC seasonal outlook is put together by a team of forecaters who put together these forecasts *every month* (El Nino or not). It is consensus based and strongly data/model driven. It is much more difficult to put together a forecast based on team consensus vs. offering one's own opinion. Also, unlike individual forecasts, these outlooks are verified (or graded) regularly. So I think it's important to distinguish individual opinion from the collaborative work of professional NOAA seasonal climate forecasters.
The blocking high seems to be a feature that has dominated the 1-month average (February), but one month isn't enough to dominate the seasonal (3-month) average. I suspect the DJF (Dec-Feb) average will likely show wetter than average conditions in northern California, so arguably the blocking high hasn't been persistent or forceful enough to keep the state entirely dry during the DJF period. Also, I think the large scale pattern is starting to look more favorable for wetter conditions in March (though these wetter conditions will not necessarily get CA out of the drought, which is a message NOAA has stated consistently since last year).
Immovable High Pressure Bubble over SoCal
RE: Immovable High Pressure Bubble over SoCal
RE: RE: Immovable High Pressure Bubble over SoCal
It's not likely that the ridges that have minimized preciptiation over Southern California are related to global warming. This pattern has certainly been less prevalent than the last few winters, but for reasons not yet understood, the majority of storminess that impacted the west coast this winter was mianly from northern California northward into the Pacific NW. While not what we had seen during the 1997/98 or 1982/83 El Ninos, that's a very small sample size to be drawing huge inferences, and other climate patterns (the Arctic Oscilation, the Madden-Julian Oscillation, maybe others) also played a role in determining the patterns of rainfall along the West Coast this past winter.
When Will Rain Arrive In SoCal?
I Think It's Over In Our Area
Question for your team
RE: Question for your team
Hi Larry, yes, we do plan on eventually taking a look at the seasonal impacts across the country and globe during this El Nino compared to previous ones and average years. As we've been saying, no two El Nino's are the same and the same goes for their impacts.
RE: Question for your team about assessment of this El Nino
RE: RE: Question for your team about assessment of this El Nino
Hi Larry,
There certainly have been extreme events with El Niños fingerprints this past year including some of those mentioned in that article. Just some examples include the drought in southern Africa, Central America, southeast Asia and across the Pacific island nations to name a few.
However, I will note that I wrote an article for the ENSO blog talking specifically about how we cannot blame every weather event on El Niño.
"But he’s like the
RE: "But he’s like the
el niño
Comments have been disabled on this article