Antici...pation: October 2016 ENSO forecast
What a difference a month can make! Since my last post, the tropical Pacific has changed gears, and now forecasters think there’s a 70% chance that La Niña conditions will develop this fall. However, any La Niña that develops is likely to be weak, and forecasters aren’t quite as confident that La Niña conditions will persist long enough to be considered a full-blown episode, giving it a 55% chance through the winter.
Ch-ch-ch-changes
When I wrote last month, the tropical Pacific wasn’t giving us much evidence that the atmosphere was responding to the slightly cooler-than-average ocean surface, and most of the computer models were predicting that sea surface temperatures would head back toward average.
Remember, La Niña (just like El Niño) requires action in both the ocean and the atmosphere. During La Niña, the ocean surface in the central and eastern tropical Pacific gets cooler than normal, leading to sinking air and less rain above that region, just as the waters near Indonesia get warmer and cause more rising air and rain. This stronger Walker Circulation is completed by stronger east-to-west surface winds and west-to-east upper level winds.
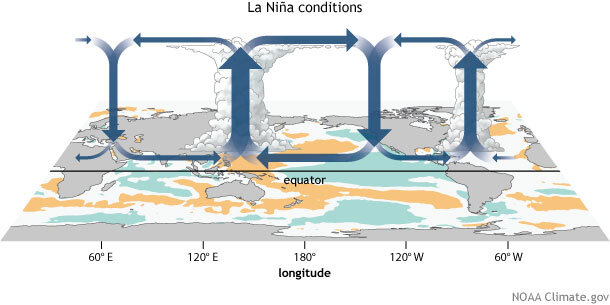
Generalized Walker Circulation (December-February) anomaly during La Niña events, overlaid on map of average sea surface temperature anomalies. Anomalous ocean cooling (blue-green) in the central and eastern Pacific Ocean and warming over the western Pacific Ocean enhance the rising branch of the Walker circulation over the Maritime Continent and the sinking branch over the eastern Pacific Ocean. Enhanced rising motion is also observed over northern South America, while anomalous sinking motion is found over eastern Africa. NOAA Climate.gov drawing by Fiona Martin.
This atmospheric circulation works to enhance the cooler ocean surface, both by blowing across the surface just like you’d cool the surface of your coffee, and also by causing cold water from the deep ocean to rise up. Have you ever blown on the surface of a cup of coffee that has cream in it, but hasn’t been stirred up? You’ll see the cream rise up to the surface, brought there by the circulation you’ve created.
Enough with the coffee! Get back to La Niña!
Right, sorry. Anyway, we really didn’t see much of this cycle happening during the summer. Some weak indications were there, but nothing really locked in, and nothing was giving forecasters much confidence that La Niña was still developing. Also, the greater cooling in the tropical Pacific Ocean that had been forecast by earlier computer model predictions from the spring and summer didn’t happen.
Then, starting around mid-September and continuing through the beginning of October, the trade winds in the central tropical Pacific area picked up.
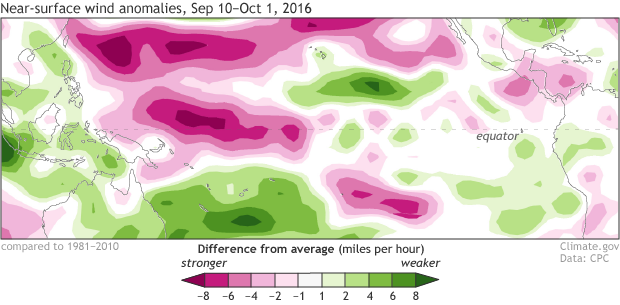
Average near-surface winds during September 10—October 1, 2016, compared to the 1982-2010 average. Negative numbers indicate that the wind is more easterly: the east-to-west wind is stronger than average. The winds along the equator usually blow east-to-west (the trade winds); the pink area shows the enhanced trades. Climate.gov figure from CPC data.
Short-term fluctuations in the wind like this can be difficult to predict more than a week ahead of time. This burst was associated with subseasonal variability—changes that happen over a few days or a couple of weeks.
Several other indicators also started to look more La Niña-like during September, including more clouds and rain over Indonesia and less in the central Pacific. The two measurements we use to follow the relationship between the conditions in the east/central Pacific and Indonesia, the Southern Oscillation Index and the Equatorial Southern Oscillation Index, are both positive. This means lower-than-average air pressure over Indonesia and higher-than-average in the east/central Pacific—a more-active Walker Circulation. (Check out Tony’s post about the many ways we measure ENSO.)
And then, of course, there’s the sea surface temperature in the Niño3.4 region, which dropped slightly during September, averaging around 0.6 degrees C below average, and became even cooler toward the end of the month.
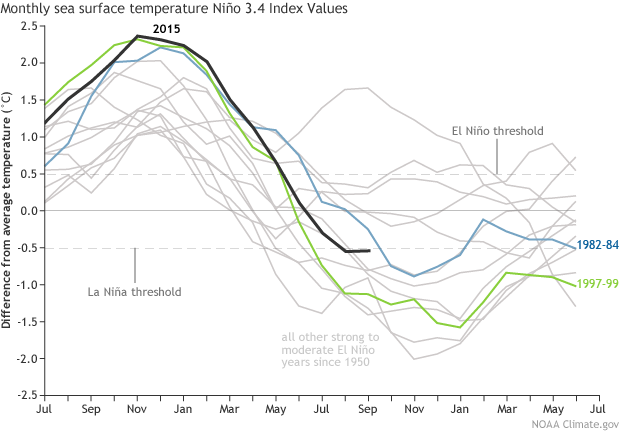
Monthly sea surface temperature in the Niño 3.4 region of the tropical Pacific compared to the long-term average for all moderate-to-strong El Niño years and the following year since 1950, showing how 2015/16 (black line) compares to other events. Climate.gov graph based on ERSSTv4 temperature data.
The amount of cool water below the surface increased a bit during September, too, after a few months of gradual reduction from the large amount that was present in the spring. This cooler water provides a source for future surface cooling.
All this adds up to a renewed La Niña Watch, as it looks like conditions are favorable for La Niña to develop.
However…
El Niño and La Niña are seasonal phenomena, meaning that these specific conditions have to be present for several months in a row. There can be short-term fluctuations in the winds, pressure, and so on, but the average over the several months must be consistent. This is why ENSO is considered a seasonal climate, not weather, phenomenon.
So we’ll watch the tropical Pacific closely over the next month, to see if the suggestions of La Niña that showed up in the second half of September are here to stay. The current computer model forecasts are predicting a few more three-month-average periods of around half a degree (C) below average in the Niño3.4 region—right at the La Niña threshold.
A weak La Niña likely means lower confidence impacts on U.S. weather and climate during the winter compared to a stronger event. Stay tuned for an upcoming post about the Climate Prediction Center’s winter outlook.
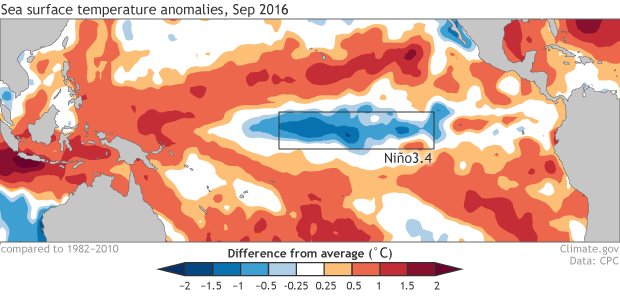
Average sea surface temperature during September, 2016, compared to the 1981-2010 average. Climate.gov figure, from CPC data. All resemblance to a lava lamp is accidental.
Comments
patterns
Nino 3.4 vs 1.2
Date in Graph
RE: Date in Graph
thanks for asking. I double checked, but, actually, no, the black label was purposely placed right at the end of 2015. Each of the lines shows the evolution of the Niño 3.4 SST anomaly for different El Niño events, beginning in year 1 of the event, and continuing on through the decay and transition period. Sorry for the confusion, though. Next time we do a similar graph, we'll consider ways to make the time periods more obvious.[[{"fid":"20124","view_mode":"default","type":"media","attributes":{"height":"464","width":"797","class":"media-element file-default"},"link_text":null,"fields":{"alignment":""}}]]
La Nina Watch
Effects of La Niña in the Central Andes region.
RE: Effects of La Niña in the Central Andes region.
The experts are very busy this week, so I am filling in on questions as best i can. Have a look at this featured image we did showing typical la Niña impacts during Northern Hemisphere winter and summer. It doesn't appear that there is a "typical" La Niña impact on the central Andes in southern hemisphere summer.
[[{"fid":"18956","view_mode":"default","type":"media","attributes":{"height":"660","width":"620","class":"media-element file-default"},"link_text":null,"fields":{"alignment":""}}]]
RE: RE: Effects of La Niña in the Central Andes region.
RE: Effects of La Niña in the Central Andes region.
RE: RE: Effects of La Niña in the Central Andes region.
This is not such an easy statement to verify. First, we don't see a La Nina impact in the Andes, except maybe right along the equator in Ecuador or Peru, on the teleconnection map for northern winter, that Rebecca provided. We would have to specify just which area in the Central Andes we're talking about. Then we would need to choose a best climate data set, whether temperature or precipitation. Then we would verify the effect of La Nina in the Andes. If the teleconnection map is correct, and we're working south of the equator in the Andes, we should see little or no systematic effect of La Nina.
RE: RE: RE: Effects of La Niña in the Central Andes region.
ENSO flip flop
RE: ENSO flip flop
The path from strong El Nino to a La Nina of some given strength often does not occur in a straight line, but rather with some bumps in the road caused by disruptions in the formation of good ocean-atmosphere coupling, by intraseasonal activity like the Madden Julian Oscillation, or others. So it is not unusual, particuarly if we look at 1-month data. Regarding the effect of climate change, it so far has not had a great effect on ENSO behavior. There are some minor ways it has affected it, such as the greater warming in the western tropical Pacific than the eastern. But as far as causing flip-flops during a period of transition, I don't know of evidence along those lines.
New England
CP La Nina versus typical one
Atmospheric impacts already being felt?
Southeast US and la Nina's
Hadley effects vs. Walker circulation in a 3-D world.
RE: Hadley effects vs. Walker circulation in a 3-D world.
The Walker and Hadley circulations interact, which is how ENSO's affects get communicated to the extratropics. Check out Tony's post on how this works: https://www.climate.gov/news-features/blogs/enso/how-enso-leads-cascade… .
Comments have been disabled on this article