May 2016 El Niño/La Niña update: Switcheroo!
There’s a 75% chance that La Niña will be in place by the fall, meaning sea surface temperatures in the central Pacific at the equator will be more than 0.5°C below average. It’s possible the transition from El Niño to La Niña will be quick, with forecasters slightly favoring La Niña developing this summer. What’s behind this reasonably confident forecast?
Current conditions
Sea surface temperatures in the Nino3.4 region, our primary index for ENSO (El Niño/Southern Oscillation), have been cooling steadily since they peaked at 2.4°C (4.3°F) above average back in November. Recently, cooling has accelerated, and April was 1.2°C above average using ERSSTv4, our most historically consistent sea surface temperature dataset from NOAA NCEI.
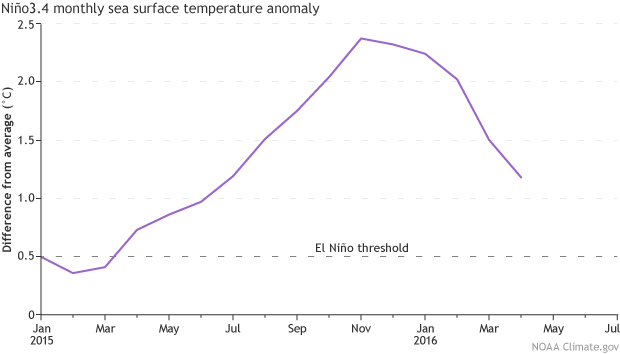
Monthly sea surface temperature in the Niño 3.4 region of the tropical Pacific compared to the 1981-2010 average. Temperatures have been falling rapidly since late winter. Climate.gov graph based on ERSSTv4 temperature data.
However, this is still well above the El Niño threshold of 0.5°C above average, and the atmosphere is still responding to those warmer surface temperatures. Both the Equatorial Southern Oscillation Index and the traditional Southern Oscillation Index were still negative in April, meaning the surface pressure in the western Pacific is still higher than average, while the surface pressure in the eastern Pacific is lower than average—evidence of a weakened Walker Circulation. (For a refresher on why we have so many different indexes for tracking ENSO, see Tony’s previous post.)
Despite these lingering signs of El Niño, the trend toward neutral conditions (Nino3.4 SST within 0.5°C of average) is very likely to continue. Most computer models are predicting El Niño conditions will come to an end in the early summer, and that sea surface temperatures will continue to drop, potentially passing the La Niña threshold (0.5°C below average) sometime in the summer. Some areas of near- or below-average sea surface temperatures have already appeared in the eastern Pacific.
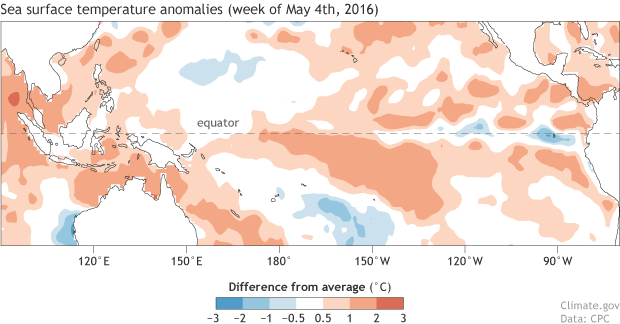
Sea surface temperatures during the week of May 4, 2016, compared to the 1981-2010 average. A few pockets of cool water have appeared in the eastern tropical Pacific (image right). Climate.gov figure by Fiona Martin, from CPC data.
Big blue blob
Along with the computer models, another feature that is lending confidence to the forecast for a La Niña is the amount of cooler-than-average water under the surface of the Pacific. This large pool of cool water stretches across the entire Pacific, along the Equator, and extends down from just below the surface to around 500 feet.
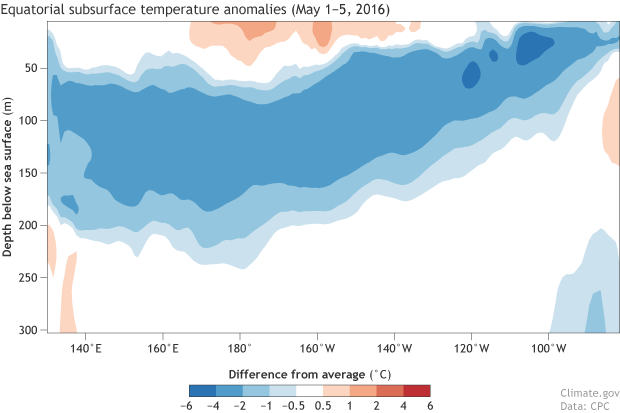
Cross-section of the equatorial Pacific Ocean for May 1-5, 2016, showing subsurface temperature (0-300 meters) compared to the 1981-2010 average. A large area of water that was 2-4 degrees Celsius cooler than normal had pooled up beneath the surface at depths of around 100-200 meters. Climate.gov figure by Fiona Martin, from CPC data.
During this past March–April, the average temperature in this part of the subsurface ocean was the second-coolest on record (records start in 1979). The coldest on record? March–April 1998, immediately following the strong El Niño event of 1997-98. Colder subsurface ocean water during the spring has a strong association with La Niña. La Niña winters followed all of the six springs with the coolest temperature anomalies (Thanks to Yan Xue of CPC for the tip!)
Fun facts
There are 14 La Niña events in our historical record, going back to 1950. (There are 23 El Niño events in the same record). To qualify as a La Niña event, the three-month-average sea surface temperature in the Niño3.4 region (the Oceanic Niño Index) must remain at least 0.5°C below the long-term average for five or more overlapping three-month periods.
Like El Niño, La Niña tends to peak in the late fall/early winter. Peak La Niña temperature anomalies (anomaly = departure from long-term average) do not tend to be quite as big as peak anomalies during El Niño, with the strongest on record being -1.9°C during November–January 1973/74. For reference, the 1997/98 El Niño and this past winter’s El Niño peaked at 2.3°C.
Of those 14 La Niñas, nine immediately followed El Niño years. Two occurred two years after an El Niño, with a neutral year intervening. Two were the second year of a “double dip” La Niña, where sea surface temperatures briefly returned to neutral during the summer before heading back into La Niña territory (1974/75 and 2011/12). The remaining one starts the records off in 1950.
In short, all La Niña events in our record have started within two years of an El Niño. (But not all El Niño events are followed by La Niña.) El Niño does not have a similar rule, as several of the 23 El Niños on record have started four or more years after the last La Niña.
La Niña events often last longer than El Niño events. Only once on record has El Niño lasted through two straight winters, 1986-1988, but it has happened with La Niña three times. The La Niña event that followed the 1997/98 El Niño lasted for thirty-three months, through three winters!
Weather wise
During July – August, La Niña has limited impacts on the northern hemisphere weather, with the exception of the hurricane season (it can contribute to a less active Pacific, more active Atlantic). There are some typical effects in the southern hemisphere during this season.
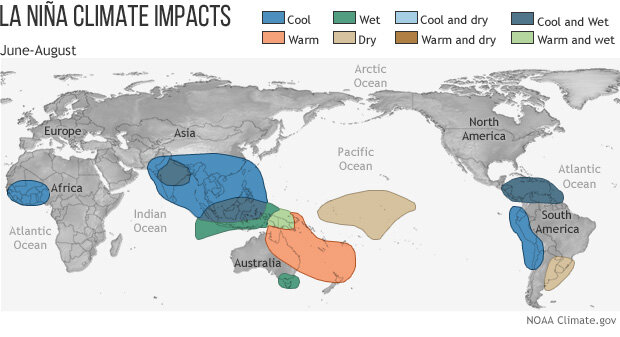
Typical rainfall and temperature patterns in the Northern Hemisphere summer during La Niña events. Most of the impacts are confined to the tropics and the Southern Hemisphere sub-tropics. These patterns become more likely during La Niña events, but they are not guaranteed. NOAA Climate.gov map.
Over the next few months, we’ll get into the effects we can expect during a La Niña winter, as well as some of the how and why. Stay tuned!
Comments
East Pacific
RE: East Pacific
RE: Sinking Mexico
ENSO probability
RE: ENSO probability
Very good question! One quick note: the climatology line in the CPC/IRI probability is based on 1981-2010 only (this has to do with the fact the World Meteorological Organization (WMO) recommends national meteorological services use this as a modern era baseline). Regardless, keep in mind that La Ninas can last for multiple years while El Ninos do not. The climatology line is per season and doesn't care whether La Nina has lasted for two years or one. So you can have more (shorter) El Nino episodes and fewer (longer) La Nina episodes and they balance out for an individual season (i.e. just within NDJ). Hope that makes.
RE: ENSO probability
Recharge Oscillator Question...
RE: Recharge Oscillator Question...
Hi Alex,
Hopefully we'll touch on some of these topics in future blog posts. We're trying appeal to a wide audience and clearly you have some prior knowledge that might lead some readers behind. :-) But some answers as I understand them:
(1) In the literature, these two mechanisms of ENSO are usually discussed seperately. This is mainly because their derivations are based on different assumptions so technically they are different. For example, the recharge-discharge mechanism is based on a derivation that essentially filters out oceanic waves which the delayed oscillator theory depends on. However, it's important to recognize that in the real world, we often see combinations of both. For example, right now we're seeing discharge of heat content (e.g. recharge-discharge), but this was preceded by an upwelling Kelvin wave along the equator (e.g. delayed oscillator). So I don't think most ENSO scientists see these mechanisms as competing, but complimentary with somewhat different emphasis. That's my impression anyways!
(2) The transition from El Nino to La Nina tends to be more straightforward and predictable than the reverse. This is related to the fact that the primary ENSO mechanisms describe this process fairly well. Where these mechanisms get "stuck" and where predictability is more limited is in the build-up phase to an El Nino. It is not as common to see La Nina transition into an El Nino. There are papers out there that hypothesize why La Nina lasts multiple years (see papers by Deser/Okumura and McGregor) and El Nino does not. Most identify the different configurations of the La Nina vs. El Nino spatial structure as culprits for why they do to not evolve similarly, but a smoking gun cause is elusive and is still a matter of research.
(3) The prominence of certain feedbacks over others tends to "explain" why SST anomalies in association with El Nino and La Nina can set up in different locations. A nice paper that explores this is Kug et al. 2010, which is available on A. Witternberg's site: http://www.gfdl.noaa.gov/~atw/yr/2010/kug_etal_2010_jc.pdf .
RE: RE: Recharge Oscillator Question...
RE: Recharge Oscillator Question...
RE: Pouring cold water on El Nino
forecast
Impact on Summer
RE: Impact on Summer
RE: Impact on Summer
effects of the El Nino?
RE: effects of the El Nino?
Thanks for the compliment! Shortly, I think Tom will do a verification post on the DJF winter outlook over the U.S. (temperature and precipitation). As for verification of the ENSO forecast itself (e.g. Nino-3.4) we're currently putting together a manuscript that will address this and also provide an overall retrospective of the 2015-16 event. If that paper is accepted and released, we'll put a note somewhere on the blog about its availability.
RE: RE: effects of the El Nino?
Also, I put together a very short note on ENSO that is available as part of the NWS Science and Technology Infusion Bulletin available here: http://www.nws.noaa.gov/ost/climate/STIP/ (scroll down to see contributions)
RE: effects of the El Nino?
Big Blue Blob
RE: Big Blue Blob
The subsurface temperatures are anomalies or deparatures from average, so the best way to think about where the below-average temperatures came from is to think of it as a displacement of typical subsurface waters. A good way to visualize this is to check out this animation which shows both the *total* temperatures (bottom panel) and the *anomalies* (top panel).
http://www.cpc.ncep.noaa.gov/products/analysis_monitoring/enso_update/wkxzteq.shtml
What is happening now is that the thermocline (which is that 20degC black contour in the bottom panel) is getting closer to the surface. As a result, the subsurface temperatures are below-average, with the largest temperature anomalies close to where the thermocline is normally.
We've been tracking the upwelling phase of a Kelvin wave (more here), which kicked off a couple months ago and is resulting in the displacement of the thermocline and below-average suburface waters. Why did it form? Well it may be the inevitable result of the decay of El Nino. We're aiming to write an article on one fairly prominent ENSO mechanism coming up in the next month, so stay tuned.
RE: RE: Big Blue Blob
the heat of El Nino
El Niño in Mendoza, Argentina
La Nina
Effects of la nina in Europe
el nino/la nina
Record Pacific Equatorial Temepratures
RE: Record Pacific Equatorial Temepratures
La nina conditions
RE: La nina conditions
CPC's seasonal outlooks are updated once a month and are available here:
http://www.cpc.ncep.noaa.gov/products/predictions/long_range/
Right now it shows a tilt toward above-average temperatures for the northeast during SON 2016. For precipiation, it is "EC" or equal chances which means all categoreis are equally likely to occur (we don't know).
NAO/AO infllunce on La Nina
RE: NAO/AO infllunce on La Nina
No significant influence of the NAO on ENSO has been documented thus far. They work on different timescales, with NAO/AO changing on subseasonal (approximately weekly) timescales, and ENSO lasting in one phase for many seasons. The NAO/AO do have a strong influence on North American weather and climate, especially during the winter.
Big blob
Southwestern US
RE: Southwestern US
The extreme rainy pattern in Texas over the past few months is not likely attributable to ENSO.
All the rain in Texas may lead to a cooler summer, though: check out this recent article posted on our sister blog, "Behind the Data".
el nino
El Niño/La Nina
Comments have been disabled on this article