Winter’s finally over: How did the NOAA Climate Outlook do in 2014-15?
Last November, I wrote a post discussing the Climate Prediction Center’s (CPC) temperature and precipitation outlooks for winter (December 2014 – February 2015). Since we’re now into March, it seems appropriate for me to look back and see how they did. In that post, I discussed the probabilistic nature of the outlook, and what the favored categories (above-, near-, and below-average) for winter temperature and precipitation were judged to be.
As a reminder, and if you haven’t memorized that post, the outlooks favored above-average temperatures in Alaska, much of the West, and also in northern New England, and below-average temperatures in the south-central and southeastern parts of the nation.
For precipitation, we favored wetter-than-normal conditions across the southern tier of the nation, extending northward along the East Coast, as well as in southern Alaska, and drier-than-normal conditions in central Alaska, parts of the Pacific Northwest and around the Great Lakes and Ohio Valley. So how did we do?
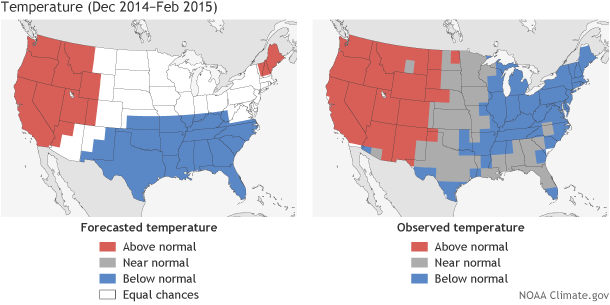
(left) Temperature forecast for December-February 2014-15, made in mid-November. The colors show the forecast category with the highest probability. White areas are where all three outcomes (warm, cool, or average) were equally likely (each had a 33.3% chance of happening). (right) Observed temperature category for December-February 2014-15. Maps by Fiona Martin for Climate.gov, based on CPC data.
There have been a number of recent posts (here, here, here) about the importance of verifying a forecast and the different metrics that we use to grade our forecasts at CPC. The simplest verification measure compares the favored category with the observed category and is shown in the figure above. This calculation is known as a Heidke Skill Score (HSS) and was discussed in this post.
Comparing the temperature forecast (left) to the observed categories (right) shows that all of the West, favored to be in the warmest one-third of the historical range of temperatures, correctly verified. So did roughly half of the region favored to be below-average in the south-central and southeastern continental US. However, the remainder of the below-average forecast did not verify, with near-average temperatures occurring instead. Northern New England had the greatest error between the forecast and what happened: a two-category error, in which one extreme was favored, but the opposite extreme occurred).
So, for the country as a whole, this forecast scored just about a 50, which means that about two-thirds of the grid boxes verified in the forecasted favored category (1). This is roughly twice the long-term seasonal temperature score (O’Lenic et al, 2008), so the forecasters at CPC are satisfied with this outlook, although folks living in northern New England who hoped for a milder-than-average winter are probably not.
The seasonal precipitation forecast (below) was not as successful as the temperature forecast, with the HSS coming it at only a 7.7, which is below our average score of around 15. Interestingly enough, the outlook correctly forecast the dry conditions around the Great Lakes and Ohio Valley, as well as the above-average precipitation along the coastal section in New England. However, much of the region across the south favored to be wetter-than-average ended up normal, with some below-average sprinkled in.
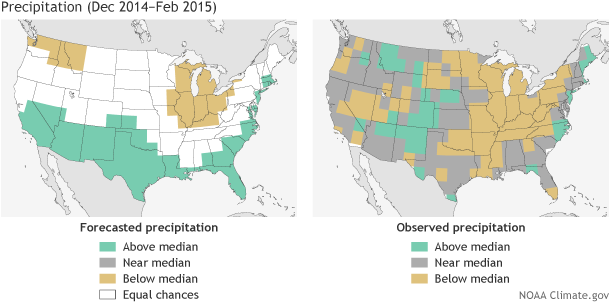
(left) Precipitation forecast for December-February 2014-15, made in mid-November. The colors show the forecast category with the highest probability. White areas are where all three outcomes (wet, dry, or average) were equally likely (each had a 33.3% chance of happening). (right) Observed precipitation category for December-February 2014-15. Maps by Fiona Martin for Climate.gov, based on CPC data.
Relative to temperature, precipitation tends to be more closely tied with ENSO. In expectation of a weak El Niño during winter, CPC forecasters tilted the forecast toward impacts associated with El Niño. which include wetter than average conditions across the southern tier of the country. However, as we have covered in previous blog posts, the lack of an overlying atmospheric response over the warm tropical Pacific SSTs may have hindered associated global impacts and therefore contributed to lower skill over the United States.
So Heidke Skill Scores (HSS) are the simplest way to grade our forecasts, where we just assume the probabilities don’t exist and everywhere on the map that had color is treated as a categorical forecast with a 100% chance. Of course, that’s not the correct interpretation as we’ve pointed out many times (here, here, here ), since these outlooks are probabilistic. That means we identify the most likely climate outcome (which becomes the categorical forecast), and the second most likely, and finally, the least likely.
Remember, even though CPC favored above-average temperatures in central and northern California with a better than 50% probability, that meant there was still a 33% chance temperatures would be near-average, and a smaller, but not zero percent change temperatures would be below average. Likewise, although above-average temperatures were favored in New England, the highest probability was only between 40% and 50%, so there was still about a 20% to 25% chance temperatures would be colder than average this winter in New England (which it obviously was).
So let’s now look at the Ranked Probability Skill Scores (RPSS) for the winter temperature and precipitation forecasts. These scores, as Tom noted, are low, since it’s quite demanding, as typical forecast probabilities of 40% to 50% only bring in partial credit even if the favored category was later observed. The only way to get high RPSS scores is to use very high probabilities (and also be correct), but given the uncertainty associated with seasonal forecasts, the use of high probabilities isn’t generally warranted. The RPSS for the temperature forecast was about 0.15, which ranks well above the long-term average shown in Tom’s post. The RPSS for the precipitation was also positive but just barely.
The verification for Alaska is not included in these scores because the grid we use over the continental US does not extend to Alaska. However, it turns out that all of Alaska did experience a milder-than-average winter, as we favored in the forecast. Precipitation, as often seems to be the case, was more mixed, with many stations along the coast wet, but others average or even drier than average. Summing up, by most measures the temperature forecast issued for the just-ended winter, while not record breaking in terms of skill, was a successful one, while the precipitation forecast was just marginally skillful, and slightly poorer than an average seasonal precipitation forecast.
So…grading the forecast is the final step of the process, as it’s very easy to make a forecast, but much more difficult to show they have value. We recommend that you track the verification skill scores over time (not just for one forecast), as they give you a feel for whether you should trust them or not. Any individual forecast could hit the mark or be way off. But you wouldn’t cut Lebron James from your basketball team because he missed his first jump shot, would you?
Footnotes
(1) This 50 makes sense, as two-thirds is half of the way between getting one-third of the grid boxes correct (the amount expected by chance), and getting all grid boxes correct.
References
O’Lenic, E. A., D. A. Unger, M. S. Halpert, and K. S. Pelman, 2008: Developments in operational long-range climate prediction at CPC. Wea. Forecasting, 23, 496-515.
Lead reviewer, Tony Barnston.
Comments
Comments have been disabled on this article