What's in store for the United States this (2014-15) winter?
After a memorably cold winter in the central and eastern United States last year, and some very cold weather this month, folks are likely wondering if this cold weather is a harbinger of things to come. The simple answer is “not necessarily,” as the persistence of weather and climate from one winter to the next or even one month to the next is usually fairly low (Livezey and Barnston 1988; Barnston and Livezey 1989; Van den Dool 1994). While “persistence”—the prediction that recent conditions will continue—is a simple forecast to make, it rarely proves to be as accurate as forecasts made using dynamical models or more advanced statistical methods (1).
So does that mean this won’t be a cold winter in the central and eastern part of the nation? Again the answer is “not necessarily.” According to the NOAA Climate Prediction Center (CPC) mid-November outlook, odds favor below-normal temperatures in certain parts of the country, and many of those areas do turn out to be in the south-central and southeastern United States, as we will discuss shortly.
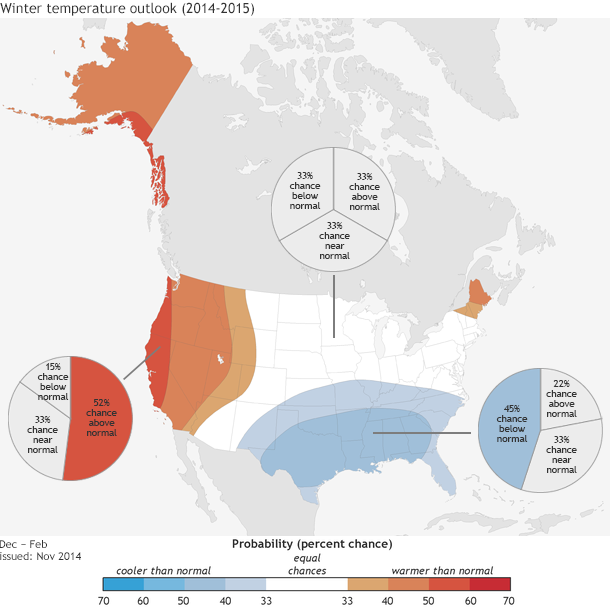
Furthermore, and perhaps more importantly, even in regions where above-normal temperatures are favored, a colder-than-normal winter is still a possibility. Remember, CPC’s outlooks describe probabilities, which means—as we’ve explained in earlier blog posts—that even when one outcome is more likely than another, there is still always a chance that a less favored outcome will occur.
The El Niño-Southern Oscillation (ENSO) provides strong clues as to what we can expect during winter across much of the United States. Of course, this only applies when El Niño or La Niña are present, and as we approach winter, we find ourselves still waiting and wondering if El Niño is going to begin or not. However, despite the reluctance of El Niño to show itself so far this year, CPC forecasters have considered potential impacts from El Niño and have slightly tilted the outlook (particularly the precipitation outlook) in that direction.
And if El Niño remains a no-show this year, what will this mean for the forecast? Actually, as you might expect, not much, because the forecasters understand the fact that El Niño has a 58% of developing, which also means that there’s a 42% chance that it won’t. To see how information about El Niño gets incorporated into the forecast, let’s take a look at the precipitation outlook. (El Niño often has a more robust influence on precipitation than on temperature.)
The winter precipitation outlook favors wetter-than-normal conditions across the southern tier of the nation extending northward along the East Coast, as well as in southern Alaska, and drier-than-normal conditions in central Alaska, parts of the Pacific Northwest and around the Great Lakes and Ohio Valley. This pattern is quite consistent with the average precipitation patterns seen during previous El Nino winters.
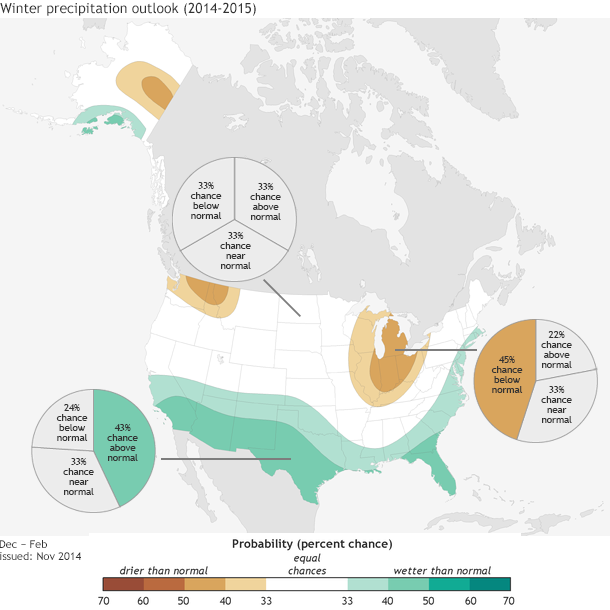
However, you’ll note that the largest probabilities on this outlook are all less than 50%. This means that while above-normal precipitation across the South is the most likely out of the 3 possibilities (below normal, near normal, or above normal), it’s more likely that we’ll see precipitation that is “not above-normal.” That is, the combined chance that the outcome will fall in one of the other two categories (near normal or below normal) is higher.
It’s like spinning a climate roulette wheel. While the “above” area is the biggest piece of the pie, the near-normal and even below-normal areas are not insignificant and could occur. These are very modest probabilities for an El Niño winter and reflect the reality that El Niño is not a sure bet for this winter. And even if it does develop, it’s likely to be a weak event, resulting in weak impacts.
For example, in contrast to this year’s ENSO situation, precipitation probabilities in Texas and Florida during the 2009-10 winter outlook exceeded 50% for above-normal rainfall, and they exceeded 70% during the peak of the 1997/98 event. In both cases, the most likely or favored result occurred, as wetter-than-average winters prevailed. This year our confidence level is not so high, but we still think the probability for above normal is higher than it would be purely due to chance, which would be 33.33%.
The temperature outlook favors a warmer-than-normal winter over Alaska, the Western United States, and northern New England, while below-normal temperatures are favored across much of the south-central (2) and southeastern parts of the nation. Probabilities of above-normal temperature exceed 50% along the West Coast, so this region has a significantly reduced chance (just 15%, according to the pie chart) of seeing a colder-than-normal winter.
Also note that both maps include areas where neither above- nor below-normal conditions is favored. Those areas are shown in white, which represents “equal chances,” and it means that the odds for above, near, or below-normal are all the same (33.33%). This doesn’t mean that temperature or precipitation is expected to be normal this winter in those regions (the probability for that is also 33.33%), but rather that there’s no tilt in the odds toward any of the three categories. Thinking back to the roulette wheel, the areas of each region would be the same, so the likelihood of any of the three categories occurring is also the same.
Making seasonal forecasts is a very challenging endeavor. Seasonal climate models are not as skillful as weather models, and phenomenon like El Niño or La Niña only provide some hints as to what might occur during an upcoming season. CPC issues probabilistic seasonal forecasts so users can take risk and opportunities into account when making climate-sensitive decisions.
However, keep in mind that these outlooks will primarily benefit those who play the long game. The maps show only the most likely outcome where there is greater confidence, but not the only possible outcome. For example, while the outlook favors above-normal temperatures in northern New England, it wouldn’t be shocking for temperatures this winter to be near-normal or even colder-than-normal. I just wouldn’t bet on it.
Footnotes
(1) However, persistence nonetheless does tend to show positive skill (i.e., it is better than just randomly guessing, or just forecasting near-normal every time), and month-to-month persistence is more likely within seasons with an El Nino or La Nina event (in locations that are influenced by ENSO).
(2) Note that this means states like Texas, Louisiana, and a few other southeastern states stand a better than average chance of experiencing a repeat of last year’s below-normal temperatures.
Lead reviewer: Anthony Barnston
References
Barnston, A. G., and R. E. Livezey, 1989: An operational multifield analog/antianalog prediction system for United States seasonal temperatures: Part II: Spring, summer, fall, and intermediate 3-month period experiments. J. Climate, 2, 513-533.
Livezey, R. E., and A. G. Barnston, 1988: An operational multifield analog/antianalog prediction system for United States seasonal temperatures: Part I: System design and winter experiments. J. Geophys. Res., 93, 10953-10974. DOI: 10.1029/JD093iD09p10953.
Van den Dool, H. M., 2007: Empirical Methods in Short-Term Climate Prediction. Oxford University Press, 215 pp.
Comments
weather forcast for this winter
RE: weather forcast for this winter
I can understand why EC (Equal Chances) is a frustrating forecast. However, there are times when there is very little model agreement or no clear preceding climate patterns in certain regions of the country. In those regions, we feel that we should not mislead folks into thinking there is a useful forecast to be made. If the answer is "we don't know," we should be honest and say we don't know which category is favored. It is also frustrating for CPC forecasters... they very much would LIKE to see model agrement and a clear climate pattern (like a stronger El Nino) that provides better ability to forecast over many regions of the country. But there are times when it is not in the cards.
In the meantime (when we're not making forecasts), many of us develop models and work on applied research projects that we hope will give us a better climate outlooks in the future.
RE: RE: weather forcast for this winter
RE: RE: RE: weather forcast for this winter
RE: RE: RE: weather forcast for this winter
RE: RE: weather forcast for this winter
RE: RE: weather forcast for this winter
RE: RE: weather forcast for this winter
RE: weather forcast for this winter
Lake Effect Precipitation
RE: Lake Effect Precipitation
Lake effect snow generally effects fairly small regions and due to it's unpredictable nature, doesn't play a role in our seasonal outlooks. Obviously the very impressive snowfall totals we've just seen along the shores of Lake Erie can effect seasonal snowfall totals, but these extreme types of events are not predictable on seasonal time scales. The average lake effect snow totals are a part of the long term climatology, but there's no way to determine whether a particular season will see less than or greater than lake effect snows.
NOAA versus the others
RE: NOAA versus the others
This is a great question. I don't know the methods of other companies (sometimes this is not provided to the public), but I do know of one difference that often shows up in presentation/format. You'll note that CPC outlooks are presented in a probabilisitic format. That is, CPC will tell you the percent chance of three different outcomes (the maps show the color of the outcome that earns the highest percent but there are chances assigned to the other 2 categories as well). There are 3 possible outcomes: above, near, or below average (temperature or precipitation). For example, instead of just telling you that there WILL be below average temperatures in a certain part of the country, CPC tells you that there may be a 40% chance of below average temperatures. The reason we do this is because there is large range of possible outcomes and many different prediction models or methods will give you different answers. We feel that we should give you information that is up-front with this uncertainty so that you can make the decision that is best for you. For some people, they will make a decision if there is a 30% chance of below-average temperatures. Others might not make a decision until there is a 70% chance of below average temperatures.
Check out the current North American Multi Model Ensemble model temperature predictions for DJF 2014-15: http://www.cpc.ncep.noaa.gov/products/NMME/current/ustmp2m_Seas1.html . There are a lof of different combinations! Some models predict below-average temperatures over much of the country, but many other models predict above-average temperatures. And there is generally no "one best model." Some models perform better in certain years than other models, so we don't necessarily know which one is going to be best for a certain year. So, we often take all this information (including more than what you see on this webpage) and we build in this uncertainy into our predictions by presenting them as "a percent chance."
Therefore, this year, as you look at our forecast maps, keep in mind that there is a chance for below-average temperatures over the entire country. However, it is just higher in certain areas (the Southeastern U.S.) than say over the West Coast, where the chance of below average temperatures is less than the chance of above average temperatures.
Also, in addition to being clear about the uncertainty in our format, CPC also provide past assessments of our forecasts showing objective scores that tell you how well the forecasts are doing. We recommend you look through this webpage to see these:
http://www.cpc.ncep.noaa.gov/products/verification/summary/
http://www.vwt.ncep.noaa.gov
RE: RE: NOAA versus the others
it's 2014 and you can't figure out a forcast
RE: it's 2014 and you can't figure out a forcast
No one says seasonal climate prediction is easy, but our aim is to give the best outlook possible with the best science available. We certainly would not discourage you from consulting other sources, but would recommend that you seek verification on their forecasts. We hope to provide a blog post in the fututure that provides gudiance on how to grade our climate outlooks (which can also be found in the verification links in the reply above).
El Nino
RE: El Nino
This is a interesting point and I believe touches on a core point. Individuals can have the same information at their fingertips and come up with different interpretations of the data. To ameliorate this at CPC we often employ "consensus based" approaches to developing outlooks meaning that we do not rely on a single forecaster but a group based decision process. I'm not familiar with the specific conference you are discussing, but it is possible they were discussing how even If California gets a normal or above normal rainfall winter this year, that would still not replinish the large deficit and drought could continue in many parts of the state.
Long Term Forecasts
RE: Long Term Forecasts
The winter outlook is the period from December-February, so despite the cold weather as of late, we still haven't yet entered into the period we are forecasting. As for CPC's verification statistics, we recommend you check out these webpages so you can see how good (or bad) the outlooks are:
http://www.cpc.ncep.noaa.gov/products/verification/summary/
http://www.vwt.ncep.noaa.gov
While we don't use moon cycles and wands because they are not discussed in the peer reviewed climate literature, we would not want to dissuade those who would prefer using these methods for prediction.
RE: Long Term Forecasts
RE: RE: Long Term Forecasts
Aside from NOAA's budget, it is true that NOAA's climate forecasts factor in all of the known influences on seasonal climate fluctuations, all supported by the historical observations. They are not made using dice or roulette wheels, or by licking one's finger and holding it up to the wind. Science is used wherever possible, and when there are no clues, the "equal chances" forecast is given, with no tilt of the odds in any direction. The smallness of the usual tilts of the odds reveals in an honest way the fairly large uncertainty of the forecasts, even when an ENSO event is in progress.
This isn't a forecast.
RE: This isn't a forecast.
Today is the last day of November, so in a couple days we will have the data to see how good CPC's November 2014 outlook was. Later on, check out the verification pages that I've linked in the comments to evaluate the quality of all of CPC's past outlooks. You are correct that in providing a percentage chance we are not ruling out any outcome, but at the same time we are providing the user information on how much we prefer in a certain outcome (e.g. a 55% chance of above average temperatures). We believe that given the large uncertainty in seasonal prediction, this is a more honest approach than telling the user "it will be warm." However, if the user would prefer to have their climate outlooks in degrees Fahrenheit, one can use the mostly likely or median prediction (the 50% tile) to obtain this information, but keep in mind that there is an equal chance the observations will occur below or above this value. We provide these maps here (for preciptiation and other seasons see the side bar):
http://www.cpc.ncep.noaa.gov/products/predictions/long_range/poe_index…
my two cents
RE: my two cents
Thank you very much. I personally find these methods very interesting! However, what stops me from weighting them is that I don't understand the physical connection between persimmon (or another method) and the upcoming winter. I'm guessing, but it would seem to imply that there is a preceding climate pattern that causes the seed to take on certain attributes (i.e. a mild autumn). More directly, we can can just look at the climate pattern and see if that helps us to predict the winter. What we find is that persistence forecasts (using the past to predict the future) are not as good (less skillful) than today's state-of-the-art statistical and dynamical models. Also, keep in mind that when CPC states "winter outlook" we are discussing the period from December-February, so we have yet to see how things turn out.
It's a forecast, their best scientific guess
question
RE: question
Great question Pete. Obviously, our seasonal forecast of impacts won't just suddenly stop at the Canadian or Mexican border in real life and the models we use are global in nature. However, the mission of the Climate Prediction Center is to provide forecasts for the United States and thus our forecasts follow the borders of the US.
If you are curious as to seasonal forecasts for Canada, I urge you to check out Environment Canada's (our counterparts to the north) forecasts located here.
Prediction
RE: Prediction
Predection
Comments have been disabled on this article