November 2019 ENSO update: the people in your neighborhood
ENSO is pretty quiet right now, with neutral conditions firmly in place. Forecasters estimate about a 70% chance that neutral conditions will continue through the winter, and a 60-65% chance through spring. With ENSO snoozing in the back yard, we’ll take a tour of the tropical neighborhood to see who else is out and about.
Snuffleupagus
Even though our old friend the Niño3.4 index (that is, the departure from the long-term average temperature in the central tropical Pacific) has spent the last few weeks hovering around 0.5°C above average, the overall El Niño/Southern Oscillation (ENSO) system is solidly neutral. To qualify for El Niño conditions, we also require an expectation that the Niño3.4 index will remain at or above 0.5°C for at least five consecutive three-month-average periods and that atmospheric patterns will change in response to the warmer central tropical Pacific water. Currently, we have neither of those additional requirements.
Most climate models predict that the temperature of the Niño3.4 region will remain close to average through the spring. As the ENSO Diagnostic Discussion says this month, the forecasters believe “the recent oceanic warmth reflects sub-seasonal variability and is not indicative of an evolution toward El Niño.” Though there still is a ~25% chance of El Niño in the winter, which means it’s worth keeping an eye on the evolution of the surface temperatures.
We monitor the temperature of the water under the surface of the tropical Pacific Ocean, because a large amount of warmer-than-average subsurface water can provide a source to the surface. After an increase in this quantity through mid-October, it has begun dissipating.
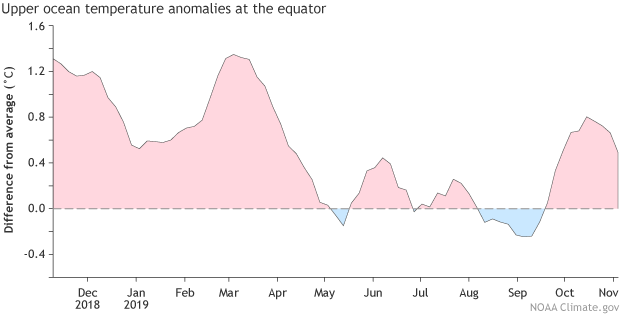
Area-averaged upper-ocean heat content anomaly (°C) in the equatorial Pacific (5°N-5°S, 180º-100ºW). The heat content anomaly is computed as the departure from the 1981-2010 base period pentad (5-day) means. Heat content increased for the first half of October, but has decreased since. Climate.gov figure from CPC data.
Count von Count
Speaking of non-ENSO variability, let’s see what other climate patterns are at play in the tropical neighborhood right now. I checked in with Dr. Kyle MacRitchie of the Climate Prediction Center and Dr. Carl Schreck of the North Carolina Institute for Climate Studies for some insight on current events. Both commented on the active Indian Ocean Dipole (IOD) and Madden-Julian Oscillation (MJO).
Kyle, author of this week’s Global Tropical Hazards Outlook, pointed out that the current positive Indian Ocean Dipole event is the strongest since at least 2015. A positive IOD “is characterized by a dipole of warmer-than-average water in the western Indian Ocean and colder-than-average water in the eastern Indian Ocean.” IOD events can last from two to seven months.
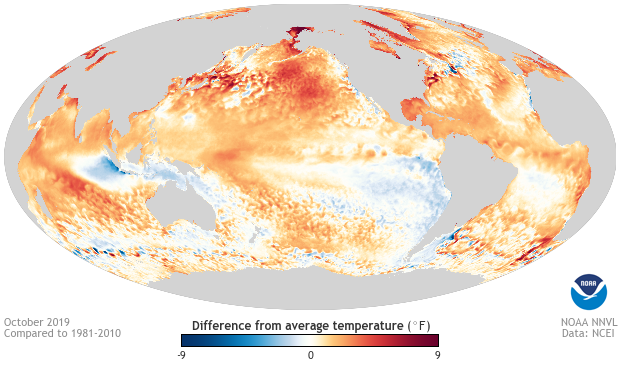
October 2019 sea surface temperature departure from the 1981-2010 average. Image from Data Snapshots on Climate.gov. The cooler-than-average water in the eastern Indian Ocean is the IOD signature. Also very noticeable here is the marine heatwave in the northern Pacific.
While it has no known impact on North America, the IOD can be very important for countries bordering the Indian Ocean. “The anomalously warm water [in the western Indian Ocean] has created a conducive environment for tropical cyclones to form this season, likely a driving cause of why tropical cyclone activity in the Indian Ocean has been about nine times greater than normal,” said Kyle. Another example of IOD impacts is below-average rainfall in Australia during their spring (September–November)—not great right now, considering the extreme fire season they’re having.
The changes in Indian Ocean surface temperature can sometimes affect the atmospheric circulation. “It was really interesting to watch the IOD totally dominate the circulation for a month (mid-Sep to mid-Oct),” said Carl.
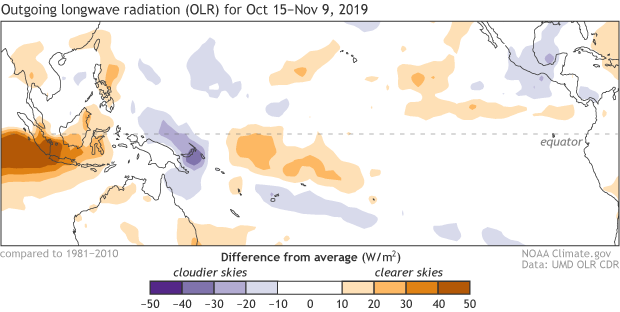
Places that were more (purple) or less (orange) cloudy than the 1981-2010 average during mid-October to mid-November 2019, based on satellite observations of OLR (outgoing longwave radiation, or heat). Thick clouds block heat from radiating out to space, so less radiation equals more clouds and rainfall, and more radiation equals clearer skies. Climate.gov map from CPC data.
Cookie Monster
The IOD isn’t the only muppet on the street, though. The Madden-Julian Oscillation (MJO) is an area of active storms and rising air that travels from west to east along the equator. We’ve discussed it before in the ENSO blog—check here for background, here for MJO-related US weather effects, and here for MJO-ENSO interaction, as well as this comprehensive post by Carl for our sister blog. The MJO has different impacts on global weather and climate based on the location of the area of active storms.
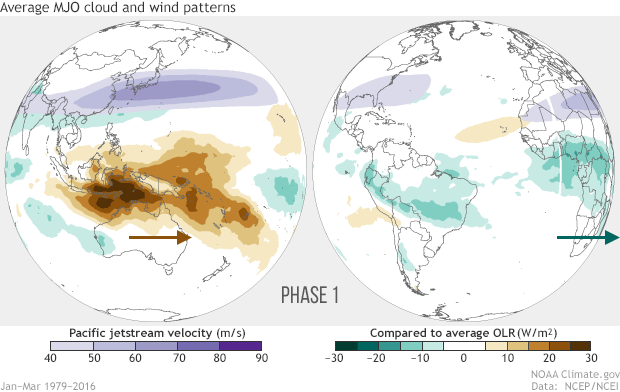
Averages of all January–March MJO events from 1979–2016. Green shading shows below-average OLR (outgoing longwave radiation, or heat energy) values, indicating more clouds and rainfall, and brown shading identifies above-average OLR (drier and clearer skies than normal). The purple contours show the location and strength of the Pacific jet at the 200-hPa level (roughly 38,000 feet at that location). Note the eastward movement of the wet and dry areas. How far the Pacific jet extends past the international dateline also changes with the phase of the MJO. NOAA Climate.gov animation, adapted from original images provided by Carl Schreck.
“There is a strong MJO right now,” says Kyle. The area of increased storminess is currently moving through the western Pacific, “and forecast to continue around the globe during the next two weeks.” In the Global Tropical Hazards Outlook, Kyle points out that the MJO is probably being partly fueled by warmer-than-average surface water in the western Pacific.
The MJO can have substantial impacts on US temperature patterns. Carl says “it’s interesting that we have a pretty robust MJO now and we’re having a significant weather event in North America (cold air outbreak). But I don't think there’s an obvious connection between the two.” Untangling cause-and-effect is a complicated process (otherwise, our jobs would just be too easy!) so it will take some time to define the sources of the current cold blast affecting much of the central and eastern US.
Big Bird
Stay tuned for our annual guest post by Mike Halpert on the winter weather outlook, coming up later this month. This post brought to you by the letters E-N-S-O, I-O-D, and M-J-O.
Comments
ENSO Blog
RE: ENSO Blog
Thank you! "Attempt" is enjoyably subtle, "muddles" is a funny word that evokes "muppets" and cocktails, and I think this sentence scans as dactylic pentameter. Masterfully done!
RE: ENSO Blog
Compliment
RE: Compliment
Thank you!
Love the references
Comments have been disabled on this article