March 2018 ENSO update: come on in, the water’s fine

The great La Niña of 2017–18 is dwindling, and forecasters expect the return of neutral conditions by the March–May season, estimated at about 55% likelihood. Neutral conditions are favored to continue through the summer. It’s too early to get a picture of next fall and winter, due to the spring predictability barrier and the absence of strong signs one way or the other. There are a few interesting features we’ll watch closely over the next few months… but first, this update on current conditions!

Stick your toe in

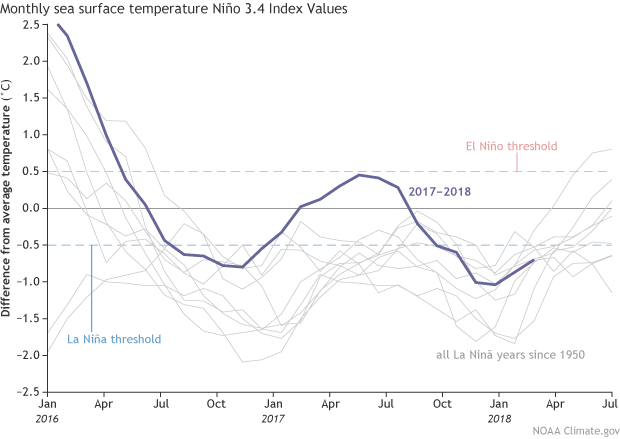
La Niña may be weakening, but she’s still making an impression on the average sea surface temperature in the equatorial Pacific. The Niño3.4 index, which measures the departure of sea surface temperature from the long-term average in the east-central equatorial Pacific, was about -0.7°C during February, using the ERSSTv5 dataset (our most consistent long-term sea surface temperature record.)

Sea surface temperature in the Niño 3.4 region graph

Monthly sea surface temperature in the Niño 3.4 region of the tropical Pacific compared to the long-term average for all multi-year La Niñas since 1950, showing how 2016–18 (blue line) compares to other events. Multi-year La Niña events are defined as at least 2 years in a row where the La Niña criteria are met. Both continuous events, when the Oceanic Niño Index (ONI) remained below -0.5°C, and years when the ONI warmed mid-year before again cooling, are included here. For three-year events, both years 1-2 and 2-3 are shown. Climate.gov graph based on ERSSTv5 temperature data.

The atmospheric elements of La Niña diminished over February, with the amount of rain and clouds the central Pacific returning to near-normal, and Indonesia actually somewhat drier than average. This is a change from the La Niña-related suppressed rainfall in the central Pacific and greater-than-average rainfall over Indonesia and that was in place over the winter. More evidence that La Niña’s enhanced Walker circulation patterns are fading appeared in the average near-surface winds over the west and central Pacific: these winds were weaker than average during February. (La Niña’s effect is to strengthen the near-surface winds.)

It’s likely that the active Madden-Julian Oscillation that Michelle chronicled last month played into the average February patterns. The MJO is an area of increased storminess that travels eastward along the equator and can circle the planet in about 1-2 months. Near-surface winds tend to blow toward this stormy area, meaning the area behind the MJO experiences more west-to-east wind. When the MJO is moving through the Pacific and into the western hemisphere, as it was during most of February, we can see the average wind patterns in the western and central Pacific become more westerly. Recently, the MJO has weakened substantially.

Making waves

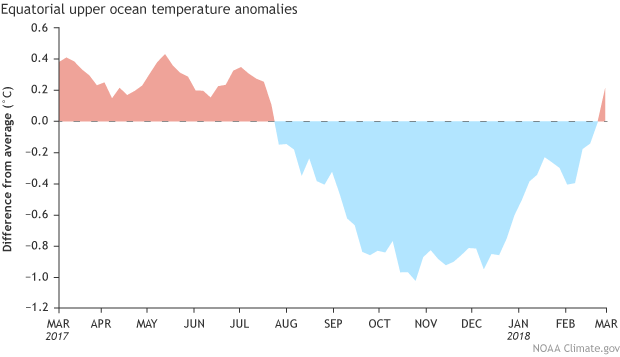
One of the many elements of the Pacific ocean-atmosphere system that ENSO forecasters monitor pretty closely is the temperature of the water below the surface. Colder than the long-term average since August 2017, these waters crept to above normal temperatures in February.

Upper-ocean heat content anomaly

Area-averaged upper-ocean heat content anomaly (°C) in the equatorial Pacific (5°N-5°S, 180º-100ºW). The heat content anomaly is computed as the departure from the 1981-2010 base period pentad (5-day) means. Climate.gov figure from CPC data.

The warming was related to an eastward-moving warmer-than-average blob primarily located between 250 and 50 meters below the surface of the western Pacific Ocean… a downwelling Kelvin wave! As this wave sloshes east under the surface, it will continue to erode the supply of cooler-than-average waters available for La Niña, providing more confidence in the forecast for neutral conditions to develop this spring.

If you feel inclined to examine subsurface temperature anomalies over the past almost-40 years, I’d encourage you to check out my Climate Prediction Center colleague Yan Xue’s great resource for ocean observations.

Pool party

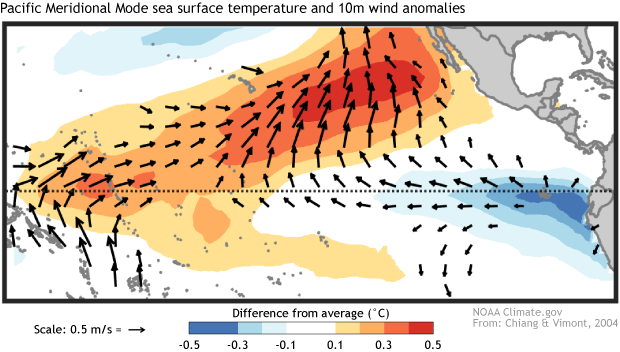
A while ago we were introduced to the Pacific Meridional Mode (PMM for short). In a nutshell, a positive PMM is a pattern of warmer-than-average sea surface temperatures stretching west from Baja California across the Pacific Ocean contrasted with cooler-than-average temperatures along the equator and into the southern hemisphere…

Tropical patterns map

Tropical patterns associated with the positive state of the Pacific Meridional Mode. Red shading indicates above-average sea surface temperature and blue shading indicates below-average sea surface temperature. Vectors show near-surface wind anomalies. Figure based on Chiang and Vimont (2004) and modified by Climate.gov.

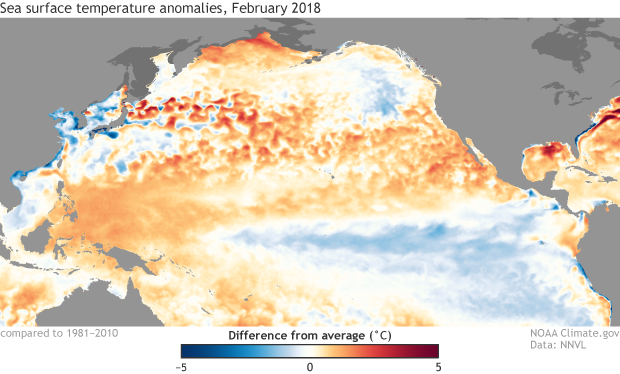
just like the sea surface temperature patterns in the Pacific observed during February.

Sea surface temperature anomaly map

February 2018 sea surface temperature departure from the 1981-2010 average. Graphic by climate.gov; data from NOAA’s Environmental Visualization Lab.

In fact, the Pacific Meridional Mode index (maintained by our guest blog author Dan Vimont) is the most positive it’s been in years. The contrast between warmer north and cooler south can influence wind patterns along the equator, thereby influencing ENSO. Of course, the global climate system is big and complicated, and it’s too early to say if this strong PMM will be a major factor as the year goes on… but you can bet we’ll be watching it.

If you’d like to compare ocean temperature patterns from this year to the past, you can visit Climate.gov’s Data Snapshots; they also have a nice display of recent temperature and precipitation patterns. Another related resource is NOAA’s Environmental Visualization Lab (select “Add Data” then “climate”). And, of course, here at the blog we’ll keep you posted on all things ENSO.
Comments

Living in Massachusetts and I was wondering if there are any baselines for (kind of) what we would receive under enso-neutral, la nina, and el nino?

Hi Emily, The observations certainly support La Niña waning to ENSO-neutral conditions, so why does the CFS suggest weak La Niña conditions continuing through summer (http://www.cpc.ncep.noaa.gov/products/people/wwang/cfsv2fcst/images3/nino34MonadjPDFC.gif)? This seems to be at odds with virtually everything else (https://iri.columbia.edu/our-expertise/climate/forecasts/enso/current/?enso_tab=enso-sst_table). Thanks, -- Matt Bunkers, SOO, NWS Rapid City, SD

Interesting article, I love this kind of stuff in fact, I want to go into this field. Why has this warm area repeated itself in the western North Atlantic for the past couple of years?

We have an explainer on our various ENSO indices here: 

https://www.climate.gov/news-features/blogs/enso/why-are-there-so-many-enso-indexes-instead-just-one

It is not the only region we monitor but we like the Nino-3.4 region b/c it is well correlated with other atmospheric measures of ENSO.  It is also one of the few regions of the tropical Pacific that is "Gaussian" which is handy from a statistics point of view (other regions are much more skewed).  

Where does our addition of CO2 enter into the history of the ENSO? There seems to be no correlation between the two.

There is a link between El Nino and carbon dioxide emissions.  Mainly El Nino causes less rainfall over Indonesia/Maritime Continent and, along w/ their annual burning, it can increase CO2 emissions.  I'm not sure how far back that record goes, but we definitely saw it in 1997-98 and in 2015-16 (two huge El Ninos):

http://www.nature.com/news/massive-el-niño-sent-greenhouse-gas-emissions-soaring-1.22440 

In reply to by Dr. Ken Towe

NOAA Operational Definitions for El Niño and La Niña, El Niño: characterized by a positive ONI greater than or equal to +0.5ºC. La Niña: characterized by a negative ONI less than or equal to -0.5ºC. By historical standards, to be classified as a full-fledged El Niño or La Niña episode, these thresholds must be exceeded for a period of at least 5 consecutive overlapping 3-month seasons. Last four ONI Index are SON 2017 -0.7ºC, OND 2017 -0.9ºC, NDJ 2018 -1.0ºC and DJF 2018 -0.9ºC. The fifth consecutive overlapping 3-month seasons ONI index is surely going to be -0.5ºC or below and hence an official 2017-18 La Nina event will be declared at the end of March 2018. It is surprising that this blog starts with these lines "The great La Niña of 2017–18 is dwindling, and forecasters expect the return of neutral conditions by the March–May season, estimated at about 55% likelihood. Neutral conditions are favored to continue through the summer."

Just wondering why the return of "neutral conditions" is even bothered to be written up as News Worthy? It seems to be an ongoing condition that doesn't hold it's severity or lack of severity very long, and is just a relatively new phenomenon, which by way of changed fronts as well as the degree of warmth patterns acting in ways we have not seen holding the time of the season(s) we see it change things. The only real trend we see is more warm fronts lasting or holding movements, creating warm like temperatures. It seems like having an entire month stretch of 40- something February's going into January and March for 10 days to two weeks or so, is a welcome front to most of us in central Wisconsin, Michigan, and up and down the Northern parts of the country, affecting areas such as New York, to Chicago, to Seattle. straight across the United States. The unknown factors have patterns of weather the meteorologists cannot predict over periods that somehow park themselves over an area for longer than a few days into 10, 12 days or even up to two weeks and beyond during spring, fall, winter, and early during summer last year. They are seeing what has not been seen before, so they cannot compare anything, as the upper atmosphere changes, doing things they (again) have never experienced prior to the event that is before them. I have no training in meteorology, but do have a toolmakers experience in seeing how changes in variables, such as the depth of a cut, at a certain speed, with a cutting tools certain radius, can have a mirror finish or not, in number 3 micro finishes, using the cutting tool to finish cut without polishing the finish. That example is no more than seeing how upper atmospheres have varied temperatures wind speeds and currents interchanging. The changes in this world are not accounted for by mankind, beyond using fuels that produce by-products, which in turn can change things they see in weather patterns. We all use fuels and other energies that produce heat itself. Spark plugs in cars produce heat, and how much heat is made in just one vehicle, for one hour operation at 35 mph or at 70 mph. So now multiply the car by how many people drive a car, and how long in hours per day, month and year. Then take into account your washing machine, hot water heater, home heating units, cooking ovens, grills, tobacco burning to smoke along with pot or other drugs smoked by millions on the planet. Start adding this up, and how many degrees of warmth are we earning? Add any other thing, like your lawn mower, and other backyard tools, weed eaters, hole diggers, chain saws, drills, wagons with motors, and so on right on down the line. How much energy is used in the world for washing dishes in hot water, alone? Even the human body produces heat. So how much heat is produced by one billion people for one 24 hour period? By now, you are "getting it". The numbers of just one factor in a variable that mankind has made happen, in producing heat, can in fact change weather strength of events. Nobody seems to be arguing anymore, the way the Rush Limbeau laughed and belittled science 20, 10, or 30 years ago, in saying auto emissions are responsible for changes in weather. He was dead wrong, and somewhat ignorant. Very ignorant. In fact, Rush would say, there is a counter-balance of hot and cold. Sure, we produce heat, but we also run air conditioners, freezers, and othere means of cooling the heat down. You or I cannot argue with Rush and other Nay-sayers. We do in fact produce cooling products. The air conditioners themselves are also producing heat! So, the counter-balance works both ways folks, once again favoring Global Warming. One other scientist in Greenland had recognized a significant factor in the Ice melting on the polar caps and around the land, as well as bodies of water near the north and south poles. When that cold ice turns to liquid it runs down and around the ocean water that travels in differed directions. This is how ships had a course going from Europe to the south American areas. The boats followed that water pattern from area "A" to area "B". There must have been water coming in from the same source even before we started burning gasoline and oil in more and more greater numbers. The one failed to report element I have failed to mention is the SUN coming down on objects that heat up. One of the greatest factors in cement or asphalt. Cement at 28 degrees, with a full day of winter sun for a few days can keep at a steady below freezing temperature on the outside, but the snow will hit that cement and melt. Why is this? The sun brought the temperature up to say 35 degrees, and that was over the freeze point. So, it melts, right? Right. So as the polar caps melt. You all have seen the shrinking caps on the north-pole, and the water flows down and away from the Calafornia area through the Pacific from the Alaska area where it began. it lands somewhere near Australia, right? Right. During the trip, it warmed up even more than the 33 to 40 degree factor it began as. During summer months it turned to the 60s in shallow areas near isles and such. Then flowed out again and was somewhat cooler in deep water, but warmed up enough to swim in with comfort in many areas. Mix it all up and you have the weather pattern of today. You and I and everyone else knows bits and pieces of what is going on. Together, is a pattern, many being now new to us, due to the changes coming quicker as the population grows. One million people might produce 100 degrees every 19 days just on our body heat. That can of heat is multiplied by the entire population divided by how many million people on the planet, which gives us an idea of what change will come, if done accurately. Of course, this is just hypothetical, in guessing on how much of a factor will become of our guesswork? There surely will be changes in our guessing the change one factor can be. There are other factors far too numerous to mention here today. I think the point was made and made for the application of science to our survival on earth, if in fact we can predict how to stabilize the weather patterns, if in fact we do need to stabilize it at all. Will it run it's course back to a more calm and predictable pattern series we saw in the "60's? Through the rest of the decades up till today, we see different subtle things changing in our predictions and actual weather, with change coming in severity factors. Many storms today are dumping record numbers of rain as well as snow and the strength of the wind, together making for a Hollywood movie come to life in actual scary changes. Let's leave it at that, and pray to God we can in fact come to realize what is needed.

Add new comment

CAPTCHA
Enter the characters shown in the image.