April 2018 ENSO update: what lurks beneath
La Niña conditions prevailed through March, but it’s very likely the great La Niña of 2017–18 is a sinking ship. ENSO-neutral conditions are expected to arrive within the next couple of months, meaning sea surface temperatures in the central Pacific will return to near the long-term average.
Amity Island
The Niño3.4 Index, our very favorite measurement of the central Pacific sea surface temperature, was about 0.5°C cooler than average over the past week, according to the weekly OISST data set. This anomaly (the departure from the long-term average) is just on the border of neutral conditions: when the Niño3.4 Index is in between -0.5°C and 0.5°C.
Animation showing sea surface temperature departure from the long-term average from late February through early April 2018. Graphic by climate.gov; data from NOAA’s Environmental Visualization Lab. (large version)
Of course, when we’re talking ENSO (the La Niña/El Niño system) we’re talking about longer than a week. When the Niño3.4 index has a monthly average warmer than -0.5°C, we’ll be back in neutral conditions. Most of the computer models are forecasting that this will happen during April–May, indicating that La Niña is likely breathing her last. As well, there are some physical factors providing confidence in this forecast—I’ll chomp into that a bit later.
During March, the atmosphere over the tropical Pacific still looked mostly (but not entirely) La Niña-ish. Specifically, less rain than average was present around and to the east of the International Date Line, which is consistent with La Niña’s strengthened Walker Circulation.
(A quick refresher: La Niña’s cooler-than-average waters lead to less rising air and cloud formation than average in the central and east Pacific, while warm waters around Indonesia pump lots of warm, moist air aloft. This amps up the average atmospheric circulation pattern of rising air over Indonesia, west-to-east transport in the upper atmosphere, descending air over the eastern Pacific, and returning east-to-west transport near the surface.)
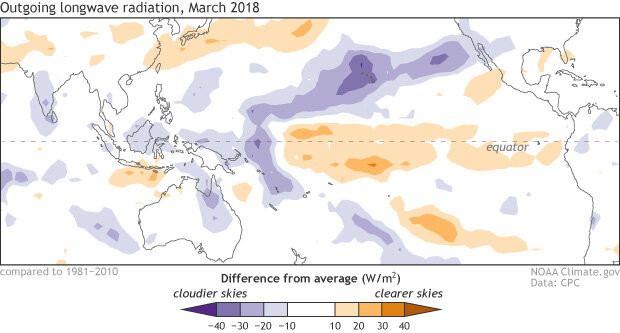
Places that were more (purple) or less (orange) cloudy than the 1981-2010 average during March 2018, based on satellite observations of outgoing longwave radiation (heat). Thick clouds block heat from radiating out to space, so less radiation equals more clouds, and more radiation equals clearer skies. Climate.gov map from CPC OLR data.
However, during March, increased convection (rising air and cloud formation) was located over the Western Pacific, farther east than the Indonesian location expected during La Niña. The near-surface winds also had a similar pattern, with stronger east-to-west winds near the Date Line, but weaker east-to-west winds over the far Western Pacific. This somewhat inconsistent atmospheric pattern suggests that La Nina still has a grip on the tropical Pacific system, but it’s weakening—as we’d expect while the surface water temperature has edged closer to average.
We’re gonna need a bigger boat
Of course, surface temperatures are just scratching the… surface. ENSO forecasters carefully monitor the temperature of the deeper Pacific Ocean, especially the upper 300 meters (about 1000 feet), between the Date Line and 100°W longitude in the eastern Pacific. These waters have been cooler-than-average since late last summer, but have been warming since about November, edging slightly warmer-than-average by the end of February, and continuing to increase during March. In fact, March’s average heat content anomaly was the highest since February 2016, during the last El Niño.
This warmer-than-average blob has been slowly moving to the east under the surface for a few months now, in the form of a downwelling Kelvin wave. As this wave surfaces over the next few months, it’ll swallow the remaining cooler surface waters.
Departure from average of the surface and subsurface tropical Pacific sea temperature averaged over the 5-day period centered on 3 April 2018. The vertical axis is depth below the surface (meters) and the horizontal axis is longitude, from the western to eastern tropical Pacific. This cross-section is right along the equator. Climate.gov figure from CPC data.
Some of the computer models are forecasting development of El Niño by next fall, but there are a number of reasons why we’re not completely taking the bait right now. First, forecasts made this time of year tend to be less successful. Another reason is that while elevated subsurface heat content in the spring sometimes precedes the development of El Niño in the fall, some recent studies have found that this relationship has not been very reliable over the past two decades*.
That said, this month’s ENSO forecast does have a slightly increased chance of fall El Niño conditions. If you were making a random forecast, El Niño would happen 35% of the time in October–December; our forecast says there’s about a 45% chance of El Niño for October–December 2018. Something to keep an eye on as we move past the spring predictability barrier.
Your trusty ENSO correspondent, signing off for another month; may your shark cages always be made of fine steel.
* References
McPhaden, M. 2012: A 21st century shift in the relationship between ENSO SST and warm water volume anomalies. Geophys. Res. Lett., 39, doi:10.1029/2012GL051826.
Wen, C., Kumar, A., Xue, Y. and McPhaden, M.J., 2014. Changes in tropical Pacific thermocline depth and their relationship to ENSO after 1999. Journal of Climate, 27(19), pp.7230-7249.
Comments
April 2018 ENSO update
My opinion on the 2018
RE: My opinion on the 2018
Stay tuned to our guest post on the recent Sudden stratospheric warming that will be posted sometime next week....
Regards: My opinion on the 2018
Nice Blog!
Comments have been disabled on this article