2020 U.S. billion-dollar weather and climate disasters in historical context
NOAA’s National Centers for Environmental Information (NCEI) has released the final 2020 update to its Billion-dollar disaster report (www.ncdc.noaa.gov/billions), officially confirming what communities across the nation experienced first-hand: 2020 was a historic year of extremes.
There were 22 separate billion-dollar weather and climate disasters across the United States, shattering the previous annual record of 16 events, which occurred in 2017 and 2011. The billion-dollar events of 2020 included a record 7 disasters linked to tropical cyclones, 13 to severe storms, 1 to drought, and 1 to wildfires. The 22 events cost the nation a combined $95 billion in damages.
Adding the 2020 events to the record that began in 1980, the U.S. has sustained 285 weather and climate disasters where the overall damage costs reached or exceeded $1 billion. (All cost estimates are adjusted based on the Consumer Price Index as of December 2020). The cumulative cost for these 285 events exceeds $1.875 trillion.
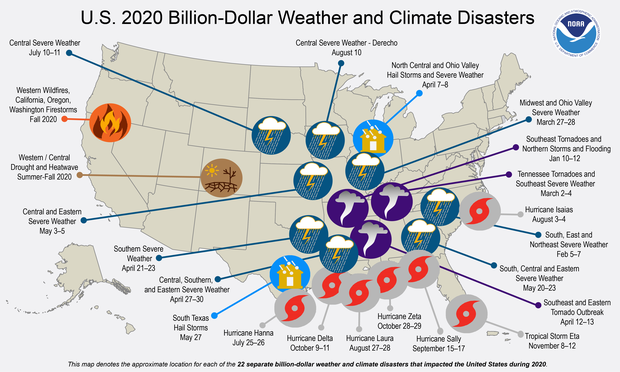
In 2020, the United States experienced record-smashing 22 weather or climate disasters that each resulted in at least $1 billion in damages, including a record 7 linked to landfalling hurricanes or tropical storms. NOAA map by NCEI.
More generally, the U.S. experienced a record-breaking number of named tropical cyclones (30), eclipsing the record of 28 set in 2005, the year of Hurricane Katrina. Of these 30 storms, a record 12 made landfall in the United States. And 7 of the 12 became billion-dollar disasters—also a new record.
Not to be left out, many central states were impacted by a historically powerful derecho on August 10, which caused impacts comparable to an inland hurricane. 2020 also brought a record-breaking U.S. wildfire season, which burned more than 10.2 million acres. California more than doubled its previous annual record for area burned (last set in 2018) with over 4.1 million acres. In total, it is clear that 2020 (red line below) stands head and shoulders above all other years in regard to the number of billion-dollar disasters.
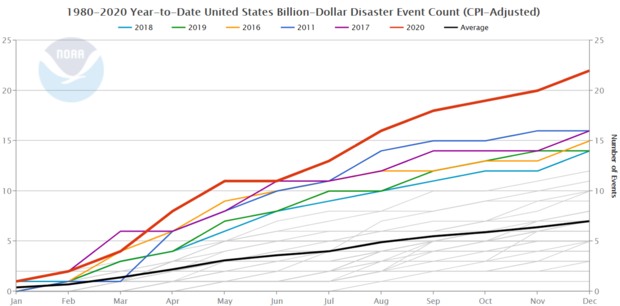
Month-by-month accumulation of billion-dollar disasters for each year on record. The colored lines represent the top 5 years for most billion-dollar disasters prior to 2020. All other years are colored light gray. Before the end of August, 2020 (red line) had broken the previous annual record for billion-dollar disasters—16—set in 2011 (royal blue) and tied in 2017 (purple). NOAA image by NCEI.
2020 costs in historical context
The billion-dollar disaster events during 2020 caused $95.0 billion in damages (red line below), which is the fourth-highest inflation-adjusted annual cost total since 1980, and more than double the 41-year average of $45.7 billion. The costliest 2020 events were Hurricane Laura ($19 billion), the Western wildfires ($16.5 billion), and the destructive August derecho ($11 billion).
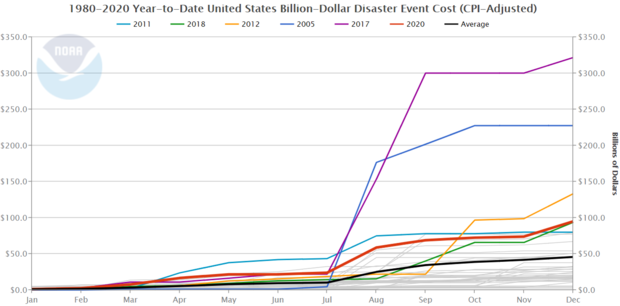
Month-by-month accumulation of estimated costs of each year's billion-dollar disasters, with colored lines showing 2020 (red) and the previous top-5 costliest years. Other years are light gray. By summer, 2020 had climbed into the top 5 costliest years on record, and it finished the year in fourth place. NOAA image by NCEI.
In broader context, the total cost of U.S. billion-dollar disasters over the last 5 years (2016-2020) exceeds $600 billion, with a 5-year annual cost average of $121.3 billion, both of which are new records. The U.S. billion-dollar disaster damage costs over the last 10-years (2011-2020) were also historically large: at least $890 billion from 135 separate billion-dollar events. Moreover, the losses over the most recent 15 years (2006-2020) are $1.036 trillion in damages from 173 separate billion-dollar disaster events.
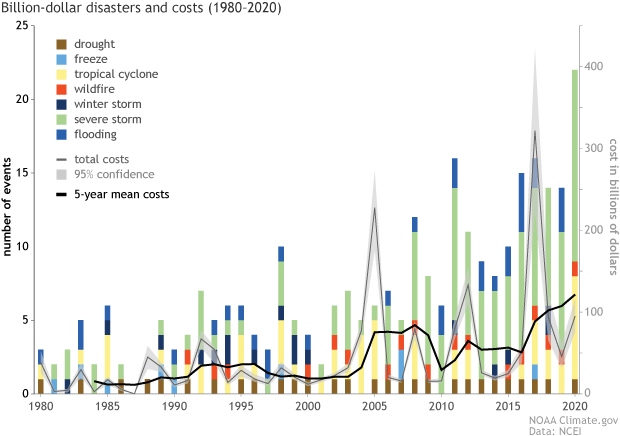
The history of billion-dollar disasters in the United States each year from 1980 to 2020, showing event type (colors), frequency (left-hand vertical axis), and cost (right-hand vertical axis. The number and cost of weather and climate disasters is rising due to a combination of population growth and development along with the influence of human-caused climate change on some type of extreme events that lead to billion-dollar disasters. NOAA Climate.gov image, based on NCEI data.
Increasing trend of high-cost disasters
The number and cost of weather and climate disasters are increasing in the United States due to a combination of increased exposure (i.e., more assets at risk), vulnerability (i.e., how much damage a hazard of given intensity—wind speed, or flood depth, for example—causes at a location), and the fact that climate change is increasing the frequency of some types of extremes that lead to billion-dollar disasters (NCA 2018, Chapter 2).
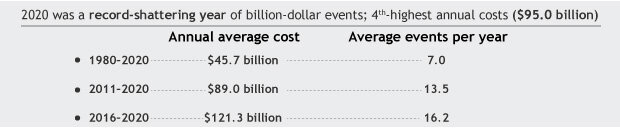
The average number and cost (CPI-adjusted) of billion-dollar disasters is on the rise.
It is important to keep in mind that these estimates do not reflect the total cost of U.S. weather and climate disasters, only those associated with events in excess of $1 billion in damages. However, these extreme events do account for the majority (>80%) of the damage from all recorded U.S. weather and climate events (NCEI; Munich Re), and they are becoming an increasingly larger percentage of the total damage costs from weather-related events at all scales and loss levels.
In particular, the historically large U.S. losses from hurricanes and wildfires over the last four years (2017-2020) have further skewed the total distribution of extreme weather costs. From 1980-2000, about 75% of all disaster-related costs were due to billion-dollar disasters, and by 2010, the percentage had risen to about 80%. By 2020, it had risen again to about 85% of all disaster-related costs, or $1.875 trillion out of $2.215 trillion.
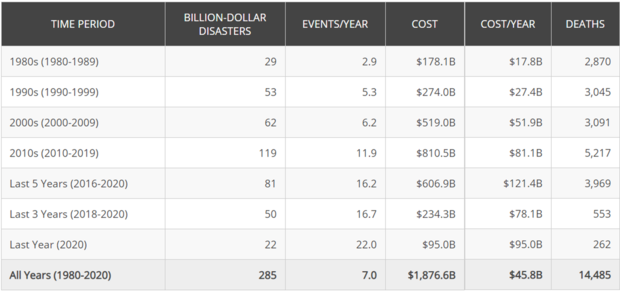
Screenshot from NCEI Billion-dollar Disaster page of a table of summary statistics on billion-dollar disasters per decade and other time scales.
Historic U.S. billion-dollar disasters of 2020
Among the many weather and climate-related disasters to affect the U.S. in 2020, the following caused the most damaging impacts and broke numerous records.
Hurricane Laura (August 2020): $19.0 billion, 42 deaths
Hurricane Laura was a powerful Category 4 hurricane that made landfall at Cameron Parish, in southwestern Louisiana, on August 27. Winds up to 150 mph and storm surge in excess of 15 feet caused heavy damage along the coast and inland to the city of Lake Charles. Many broken water systems and a severely damaged electrical grid in southern Louisiana will slow the recovery process.
Category-4 Hurricane Laura made landfall during the early morning hours of August 27, 2020, at Cameron, Louisiana. Winds up to 150 mph and storm surge in excess of 15 feet caused heavy damage along the coast and inland to the city of Lake Charles. NOAA GOES-East image from the NOAA satellite team.
Laura was the strongest hurricane (by maximum sustained wind speed at landfall) to hit Louisiana since the 1856 Last Island hurricane. Laura also had highest landfall wind speed to impact the U.S. since Hurricane Michael in 2018. There were additional impacts to surrounding states including Texas, Mississippi, and Arkansas.
Historic Midwest Derecho (August 2020): $11.0 billion, 4 deaths
A powerful derecho traveled from southeast South Dakota to Ohio, a path of 770 miles in 14 hours producing widespread winds greater than 100 mph. The states most affected included Iowa, Illinois, Minnesota, Indiana, and Ohio. This derecho caused widespread damage to millions of acres of corn and soybean crops across central Iowa.
A line of severe thunderstorms produced a widespread, fast-moving windstorm called a derecho on August 10, 2020. The GOES-East satellite captured this IR image of clouds and lightning as the derecho moved eastward from Iowa to Indiana. Image by the NOAA satellite team.
There was also severe damage to homes, businesses and vehicles particularly in Cedar Rapids, Iowa. In addition, there were 15 tornadoes across northeastern Illinois, several affecting the Chicago metropolitan area. This derecho is the third severe weather event (since 1980) with inflation-adjusted costs over $10.0 billion, joining the late-April and May 2011 tornado outbreaks across the Southeastern and Central states, respectively.
Western Wildfires - California, Oregon, Washington Firestorms (August-December 2020): $16.5 billion, 46 deaths
A record-breaking U.S. wildfire season burned more than 10.2 million acres. California more than doubled its previous annual record for area burned (last set in 2018), with over 4.1 million acres. Five of the top six largest wildfires on record in California (dating to 1932) burned during August and September of 2020. The August Complex was the largest California wildfire, which began as 37 separate wildfires within the Mendocino National Forest, set off after storms caused more than 10,000 lightning strikes across Northern California. Approximately 10,500 structures were damaged or destroyed across California.
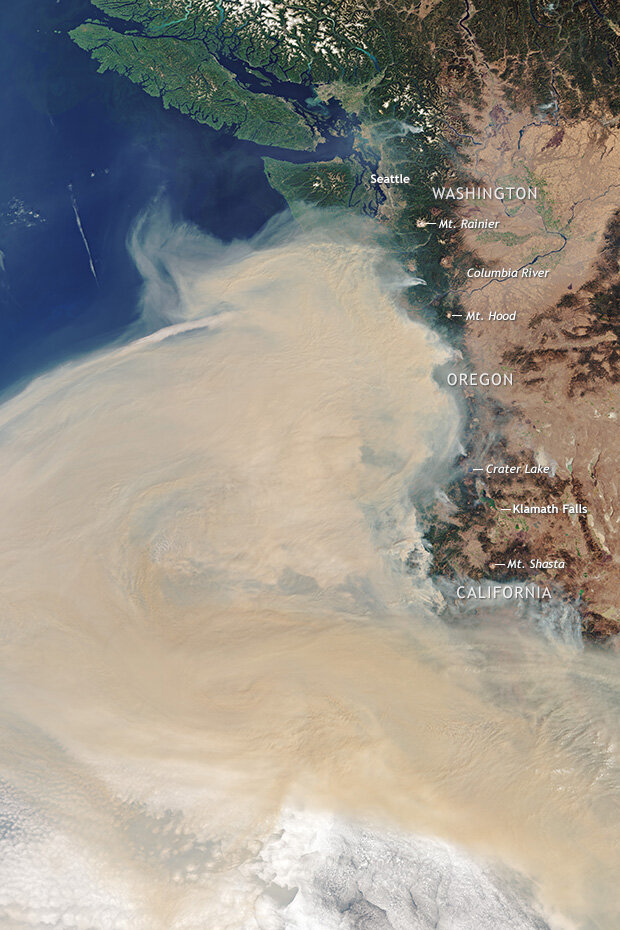
A massive cloud of yellow-brown smoke from numerous wildfires blanketed the U.S. West Coast from Washington to California on September 10, 2020. European Space Agency satellite image using Copernicus Sentinel data, from Wikimedia.
Oregon also had historic levels of wildfire damage, as over 2,000 structures burned. These wildfires spread rapidly and destroyed several small towns in California, Oregon, and Washington. Colorado also had a severe wildfire season, as its three largest wildfires on record burned during 2020. Dense wildfire smoke also produced hazardous air quality that affected millions of people for weeks. Hundreds of additional wildfires also burned across other Western states.
Hurricane Sally (September 2020): $7.3 billion, 5 deaths
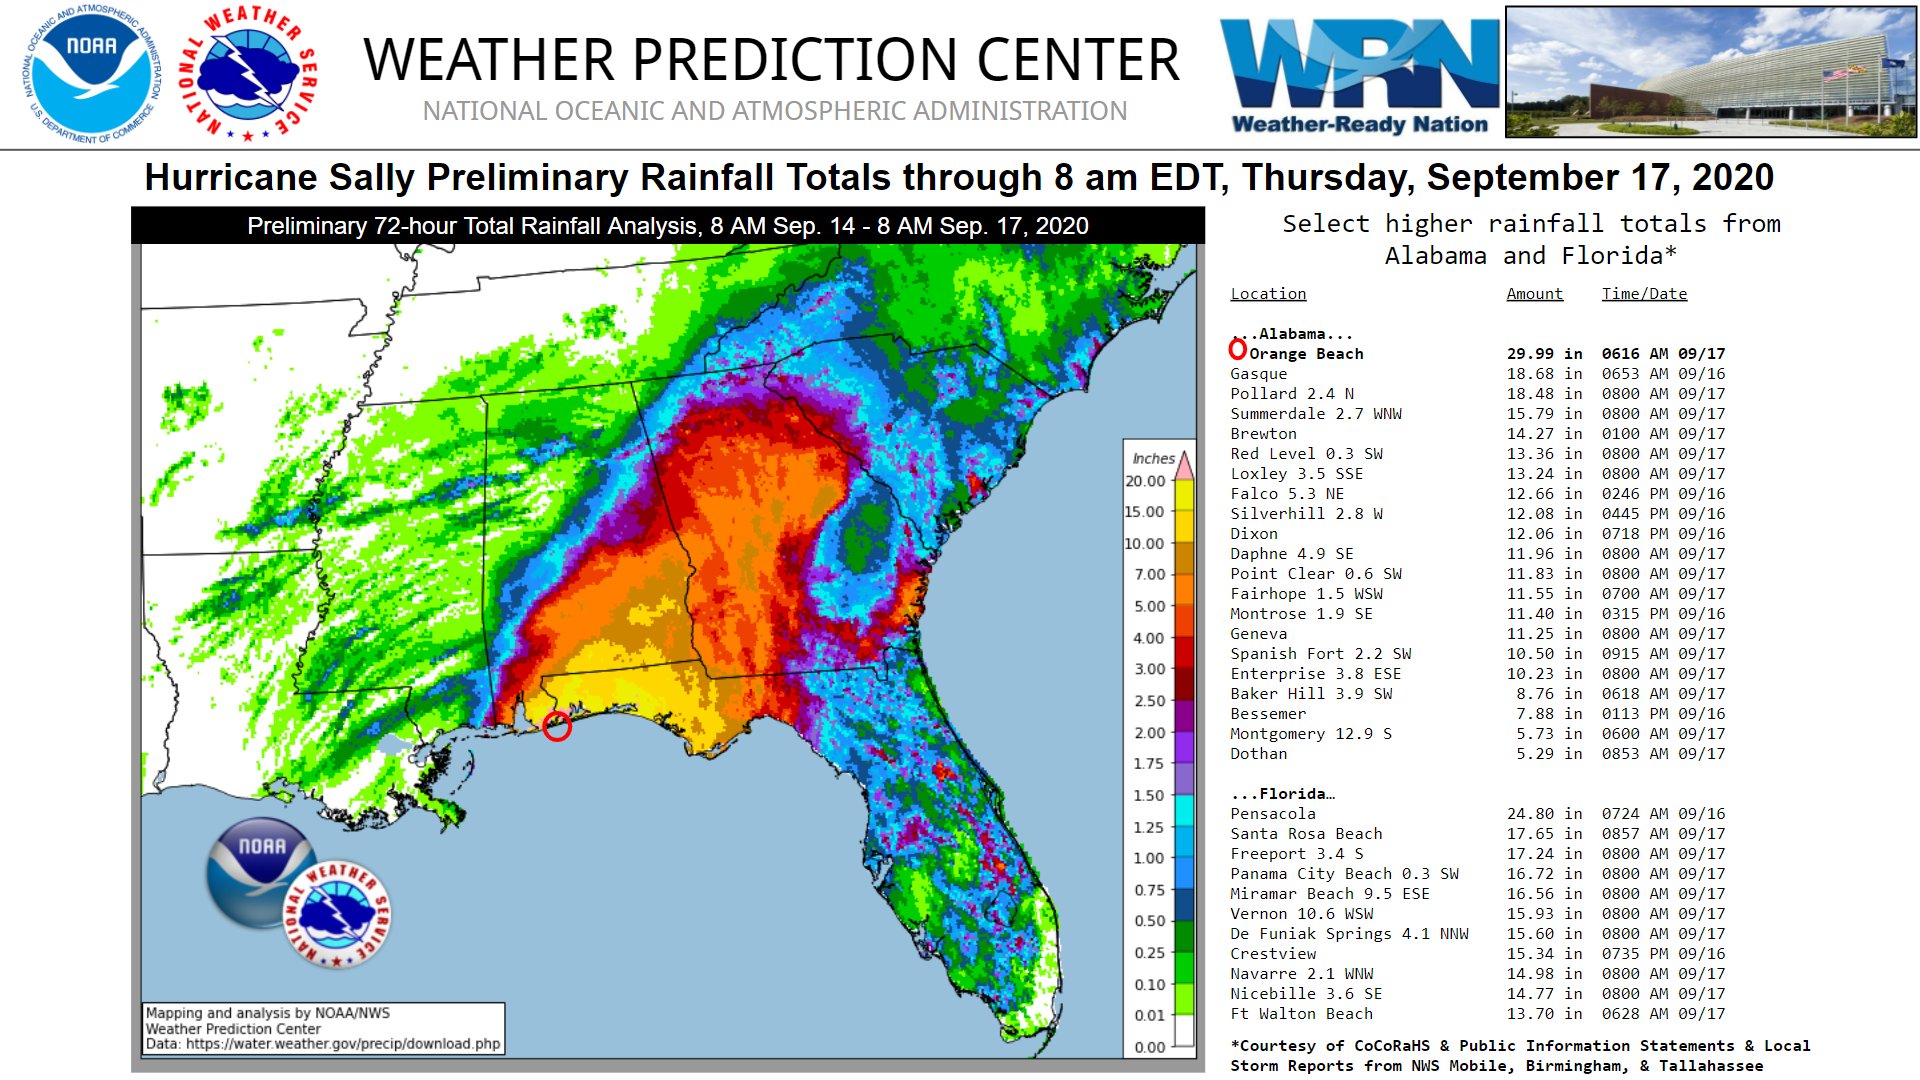
Hurricane Sally was a Category 2 hurricane at landfall in Gulf Shores, Alabama. Wind gusts up to 100 mph and 20-30 inches of rainfall caused considerable flood and wind damage across Alabama, the Florida panhandle, and into Georgia. Many homes and businesses in downtown Pensacola, FL, were impacted from flooding produced by storm surge and heavy rainfall.
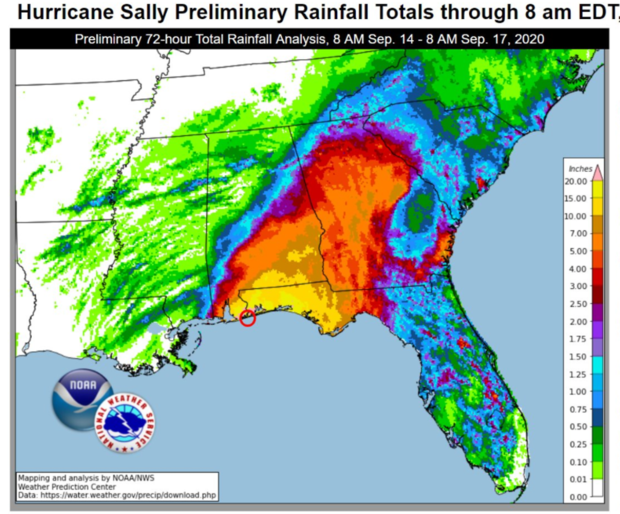
Hurricane Sally brought heavy rain to multiple states in the Southeast in mid-September 2020. This map shows estimate rainfall totals from September 14–17, 2020. Parts of western Florida and Alabama got more than 10 inches of rain. Image from NOAA's Weather Prediction Center.
2020 is now the fourth consecutive year (2017-2020) that the U.S. has been impacted by a slow-moving tropical cyclone that produced extreme rainfall and damaging floods: Harvey, Florence, Imelda and Sally.
Distribution of costs and fatalities by disaster type
The distribution of damage from U.S. billion-dollar disaster events from 1980 to 2020 is dominated by tropical cyclone losses. Tropical cyclones have caused the most damage ($997.3 billion) and also have the highest average event cost ($19.2 billion per event). Drought ($258.9 billion), severe storms ($286.3 billion), and inland flooding ($151.0 billion) have also caused considerable damage based on the list of billion-dollar events.
Severe storms have caused the highest number of billion-dollar disaster events (128), but they have the lowest average event cost ($2.2 billion). Tropical cyclones and flooding represent the second and third most frequent event types (52 and 33), respectively. Tropical cyclones are responsible for the highest number of deaths (6,593), followed by drought/heatwave events (3,910) and severe storms (1,762).
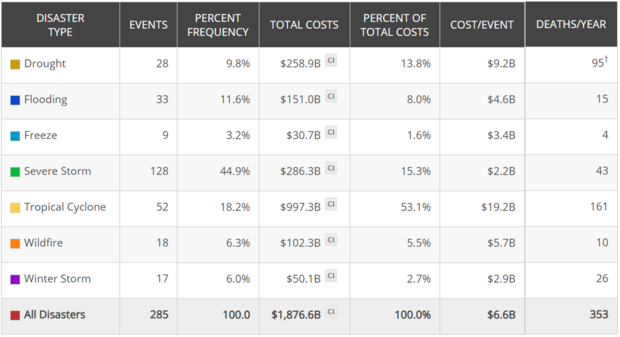
This table shows the breakdown, by hazard type, of the 285 billion-dollar weather and climate disasters assessed since 1980. Screenshot from the NOAA NCEI Billion-dollar Disasters webpage.
The increase in population and material wealth over the last several decades, are an important cause for the rising costs. These trends are further complicated by the fact that much of the growth has taken place in vulnerable areas like coasts and river floodplains. Vulnerability is especially high where building codes are insufficient for reducing damage from extreme events.
But climate change is also paying a role in the increasing frequency of some types of extreme weather that lead to billion-dollar disasters—most notably the rise in vulnerability to drought, lengthening wildfire seasons in the Western states, and the potential for extremely heavy rainfall becoming more common in the eastern states. Sea level rise is worsening hurricane storm surge flooding. (Read more about changes in climate and weather extremes in the U.S. National Climate Assessment.)
The geography of billion-dollar disaster events by type
The U.S. is weather- and climate-conscious for good reason, as each geographic region faces a unique combination of recurring hazards. In fact, billion-dollar disaster events have touched every U.S. state. The maps below reflect the frequency with which each state has been part of a billion-dollar disaster event (i.e., the totals do not mean that each state alone suffered $1 billion in losses for each event).
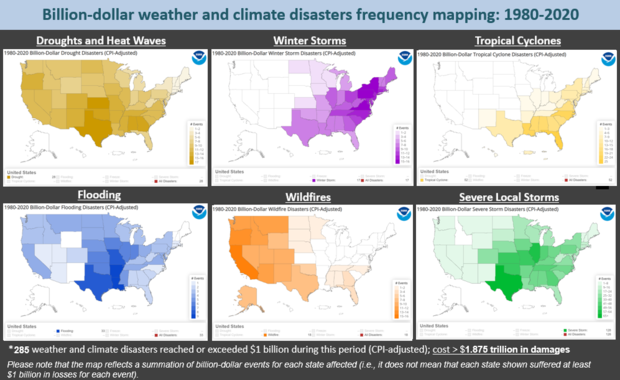
Maps depict the number of times each state has been affected by different types of billion-dollar weather and climate disasters. Note that each state did not necessarily experience a full billion-dollar cost for an event to be counted; it only needed to be part of a regional event that caused one billion dollars or more in direct damages. Image based on screenshots from the NCEI Billion-dollar Disasters webpage.
Each disaster type has a distinct footprint of impact over time. We see wildfire impacts largely west of the Plains states, with a few Southeast impacts. However, the most intense and destructive wildfires occur in California–most notably after the year 2000.
There is also a high frequency of inland flooding events that occur in states adjacent to large rivers or the Gulf of Mexico, which is a warm source of moisture to fuel rainstorms. Drought impacts are mostly focused in the Southern and Plains states, where there are billions of dollars in agriculture and livestock assets.
Crop freeze events have become more sporadic since the early 1990s, but these events can still cause considerable damage in the fruit-producing states of California, Florida, and other southeastern states such as Georgia and South Carolina.
Severe local storm events are common in the Plains and into the Ohio River Valley states. Winter storm impacts are concentrated in the Northeast given the population density and more assets exposed to powerful Nor’easters bringing wind, snow, ice, and storm surge. Tropical cyclones are the most costly disaster we assess, and they create impacts from Texas to New England, but also include many inland states as a result of extreme rainfall and inland flood damage.
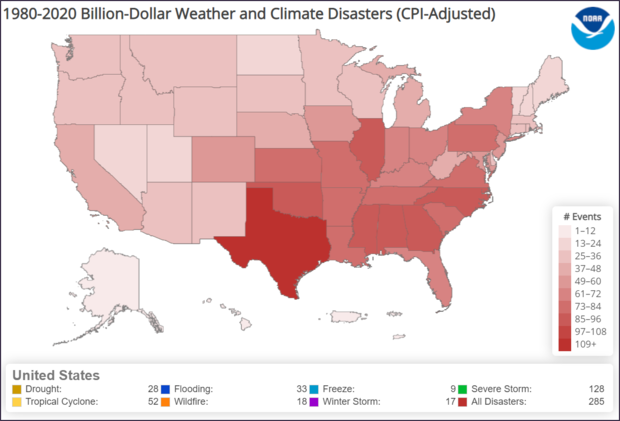
This map depicts the number of billion-dollar weather and climate disasters affecting each state, since 1980, regardless of hazard type. Note that each disaster did not necessarily cause one billion dollars in damages in an individual state to be included in this total. Screenshot from the NCEI Billion-dollar Disasters webpage.
In total, from 1980–2020, the U.S. South, Southeast and Central regions experienced a higher frequency and diversity of billion-dollar disaster events than any other regions, as shown in the red total disaster frequency map. The South has also suffered the highest cumulative damage costs, reflecting the diversity, frequency, and severity of weather and climate events impacting the region.
Each state has been affected by at least 1 billion-dollar disaster since 1980. Texas has experienced the highest number of events (124) and is one of the few states that have been impacted by all seven types of the billion-dollar disasters we analyze.
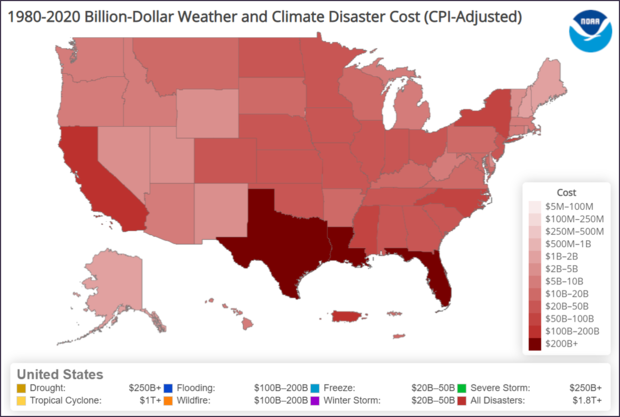
This map depicts the total estimated cost borne by each state from billion-dollar weather and climate events from 1980-2020. Screen shot from NCEI's Billion-dollar Disasters webpage.
The South, Central and Southeast regions of the U.S., including the Caribbean U.S. territories, have suffered the highest cumulative damage costs, reflecting the severity and widespread vulnerability of those regions to a variety of weather and climate events. In addition to the highest number of billion-dollar disasters experienced, Texas also leads the U.S. in total cumulative costs (~$290 billion) from billion-dollar disasters since 1980. Florida is the second-leading state in total costs since 1980 (~$230 billion), largely the result of destructive hurricane impacts.
Louisiana has the 3rd highest total costs (~$205 billion) from billion-dollar disasters, but has a much smaller population and economy than either Texas or Florida. Therefore, the relative cost and impact from extremes in Louisiana is more severe and difficult to recover. Also, a high frequency of disasters can lead to a compounding of impacts. 2020 is no exception as Louisiana was impacted by five different tropical cyclones from a historically active Atlantic hurricane season.
Another way to examine damage is to compare each state’s annual disaster losses relative to their Gross State Product (GSP), which represents economic output. The relative impacts of both the August derecho in Iowa and Hurricane Laura in Louisiana most stand out during 2020. Also, numerous other southern states had outside impacts of disaster damage relative the each state’s economic output through a combination of hurricane and tornado outbreak impacts.
Billion-dollar disasters by month
The new 41-year climatology of U.S. billion-dollar disasters offers a view of risk from extreme events, which are often seasonal in nature. For example, during the spring months (March-May) severe storms, including tornadoes, hail, and high winds often occur in many Central and Southeast states. During the spring months there is also potential for major, river flooding (i.e., deep blue events in chart above). U.S. springtime flooding from snowmelt and/or heavy rainfall is a persistent hazard that affects many towns and agriculture regions within the Missouri and Mississippi River basins, among others.
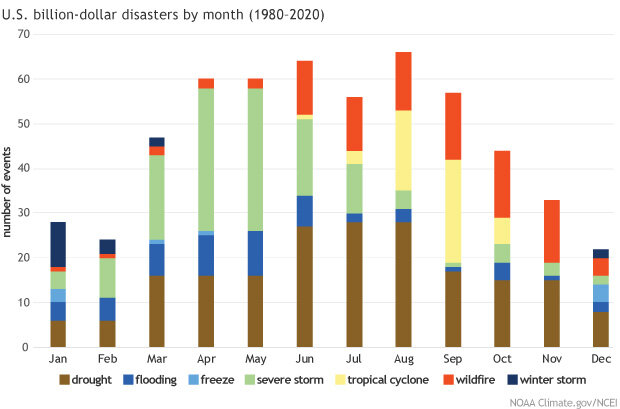
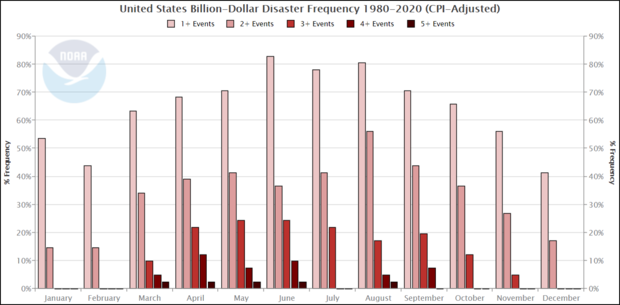
The monthly climatology of U.S. billion-dollar weather and climate disasters from 1980 to 2020, showing which months have the greater frequency of disasters and which types of events are most likely to occur in a given month. NOAA Climate.gov image, based on NCEI data.
During the fall season, Gulf and Atlantic coast states must be vigilant about hurricane season, particularly during August and September (i.e., yellow events in chart above). Hurricanes are the most destructive and costly of these events totaling damage losses near $1 trillion since 1980. For example, in 2016-2018, the U.S. was impacted by 6 separate billion-dollar hurricanes (i.e., Matthew, Harvey, Irma, Maria, Florence, Michael) with an inflation-adjusted loss total of $339.7 billion and 3,318 fatalities. As a comparison, the U.S. also experienced a series of active hurricane seasons from 2003-2005 where 9 separate billion-dollar hurricanes (e.g., Charley, Ivan, Katrina, Rita, Wilma, etc.) made landfall, with an inflation-adjusted loss total of $308.1 billion and 2,225 fatalities.
Also, the peak of the Western U.S. wildfire season occurs during the fall months of September, October and November (i.e., orange events in chart above). California, Oregon, and Washington are often states that face wildfire risk and related poor air quality for weeks to months. Western wildfire season is also becoming more hazardous, as 17 of the 20 largest California wildfires by acreage and 18 of the 20 most destructive wildfires by # of buildings destroyed have occurred since the year 2000. In three of the last four years (2017-2020) wildfires have produced record-levels of cost. In 2020, wildfires burned the most acres on record in the U.S. - more than 10.25 million.
In total, each region of the U.S. faces a unique combination of recurring hazards, as billion-dollar disaster events have affected every state since 1980. The two charts above highlight how the frequency of billion-dollar disasters differs across both time and space. The combined historical risk of U.S. severe storms and river flooding events makes the spring and summer seasons the high-risk time for simultaneous extreme weather and climate events.
Billion-dollar weather and climate disasters occur in all months, but the spring and summer (March–Aug) are the time when multiple, concurrent disasters are likely. Screenshot from the NCEI Billion-dollar Disasters webpage.
The increase in disaster create 'compound extremes' (e.g., billion dollar disaster events that occur at the same time or in sequence), which are also an increasing problem for recovery. As noted in National Climate Assessment (2017) "the physical and socioeconomic impacts of compound extreme events (such as simultaneous heat and drought, wildfires associated with hot and dry conditions, or flooding associated with high precipitation on top of snow or waterlogged ground) can be greater than the sum of the parts."
Many of the tables and maps shown in this article are screenshots from NCEI’s interactive Billion-dollar Disasters webpage. Visit the page to create your own summaries or download source data. In 2021, NCEI will continue to incorporate new layers and filters that offer added flexibility to the online tools for additional context and analysis. For additional context on data sources, methods, metrics, caveats and reports see: https://www.ncdc.noaa.gov/billions/references.
Comments
question re: disaster costs
RE: question re: disaster costs
I'm sharing this response from Adam via email:
Comments have been disabled on this article