2018's Billion Dollar Disasters in Context
NOAA’s National Centers for Environmental Information (NCEI) tracks U.S. weather and climate events that have great economic and societal impacts. Since 1980, the U.S. has sustained 241 weather and climate disasters where the overall damage costs reached or exceeded $1 billion (including adjustments based on the Consumer Price Index, as of January 2019). The cumulative cost for these 241 events exceeds $1.6 trillion.
During 2018, the U.S. experienced a very active year of weather and climate disasters. In total, the U.S. was impacted by 14 separate billion-dollar disaster events: two tropical cyclones, eight severe storms, two winter storms, drought, and wildfires. The past three years (2016-2018) have been historic, with the annual average number of billion-dollar disasters being more than double the long-term average. The number and cost of disasters are increasing over time due to a combination of increased exposure, vulnerability, and the fact that climate change is increasing the frequency of some types of extremes that lead to billion-dollar disasters.
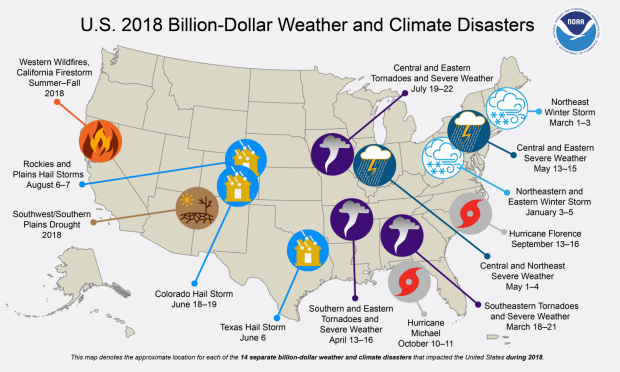
This map depicts the general location of the fourteen weather and climate disasters assessed to cause at least one billion dollars in direct damages during 2018.
Number of events
The 14 separate U.S. billion-dollar disasters in 2018 represent the 4th highest total number of events, behind only the years 2017 (16 events), 2011 (16) and 2016 (15). The most recent years of 2018, 2017 and 2016 have all been historic in the number of billion-dollar disasters that have impacted the U.S. – totaling 45 separate events. This is a 3-year average of 15 disaster events / year, the highest on record, and well above the annual inflation-adjusted average of 6.2 events per year (1980-2018). In addition, this 3-year average even exceeds the annual inflation-adjusted average of 12.6 events per year over the last 5-years (2014-2018).
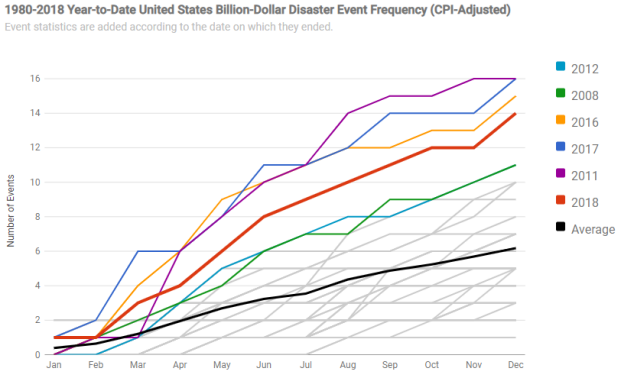
The month-by-month accumulation of billion dollar disasters for each year on record. The value for a given year for a given month shows the total number of billion-dollar events that had occurred by that month. Note that there is considerable overlap, and some years' traces are obscured.
Cost Comparisons
The year 2018 also experienced the 4th highest total costs ($91.0 billion), as noted below in the data plot. The combined costs of the 2018 disasters trails only the years 2017 ($312.7 billion), 2005 ($220.8 billion) and 2012 ($128.6 billion) when all years are inflation-adjusted to January 2019 dollars.
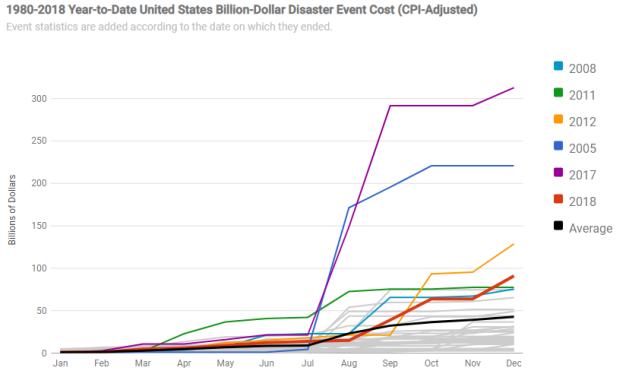
The accumulation in the estimated cost of billion dollar weather and climate disasters on a monthly basis, for each year since 1980
The annual cost average for billion-dollar disasters is $42.8 billion (CPI-adjusted) over the period of record (1980–2018). The annual cost average over the last 5-years (2014–2018) is $99.1 billion (CPI-adjusted), more than double the long-term average. In fact, the total cost over the last 5 years (2014-2018) is approximately $500 billion, which is nearly $100 billion / year. This 5-year average annual cost is indicated by the black line in the following time-series.
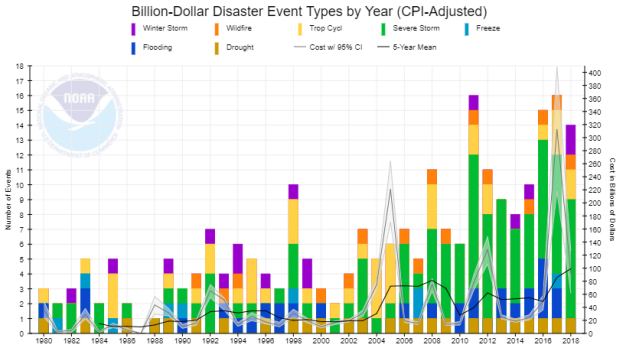
The number (bars, left axis), type (colors), and annual cost (right vertical axis) of U.S. billion-dollar disasters from 1980-2018. Running annual cost (grey line), along with the 95% confidence interval, and 5-year average costs (black line).The number and costs of disasters are increasing. Inland flooding (blue bars) and severe storms (green bars) are making in increasingly large contribution to the number of U.S. billion-dollar disasters.
As noted in the 4th National Climate Assessment, published in November 2018, the U.S. has experienced over $400 billion in weather and climate disaster costs since 2014. In fact, using our most recent analysis, over the last 3-years (2016-2018) the U.S. has experienced disaster costs exceeding $150 billion / year. In addition, these costs actually represent a conservative measure of what is truly lost but cannot be fully measured given data limitations.
Worrisome trends
Keep in mind that these estimates do not reflect the total cost of U.S. weather and climate disasters, only those associated with events in excess of $1 billion in damages. However, these extreme events do account for the majority (>80%) of the damage from all recorded U.S. weather and climate events (NCEI; Munich Re). These billion-dollar disaster events are becoming an increasingly larger percentage of the cumulative damage from the full distribution of weather-related events at all scales and loss levels. Clearly, the historically large U.S. losses from hurricanes and wildfires over the last few years have further skewed the total distribution of extreme weather costs. This increase reflects a combination of increased exposure, vulnerability and the fact the climate change is playing an increasing role in the increasing frequency in some types of extremes that lead to billion-dollar disasters.
- 1980-2000 …(~75% of full distribution)
- 1980-2010 …(~80% of full distribution)
- 1980-2018 …(~85% of full distribution):
- $1.67 trillion of $1.95 trillion in total US weather and climate events costs
The Historic U.S. Billion-dollar Disasters of 2018
Among the weather and climate-related disasters to affect the U.S. in 2018, the following caused the most damaging impacts and broke records.
Western Wildfires, California Firestorms (Summer-Fall 2018)
In 2018, California experienced its costliest, deadliest, and largest wildfires to date, with records back to 1933. The Camp Fire was the costliest and deadliest wildfire in state history, destroying more than 18,500 buildings. California also endured its largest wildfire on record—the Medincino Complex Fire, which burned more than 450,000 acres. Additionally, California was impacted by other destructive wildfires: the Carr Fire in Northern California and the Woolsey Fire in Southern California. The total 2018 wildfire costs in California (with minor costs in other Western states) approached $24 billion, a new U.S. record. In total, more than 8.7 million acres burned across the U.S. during 2018, which is well above the 10-year average (2009-2018) of 6.8 million acres.
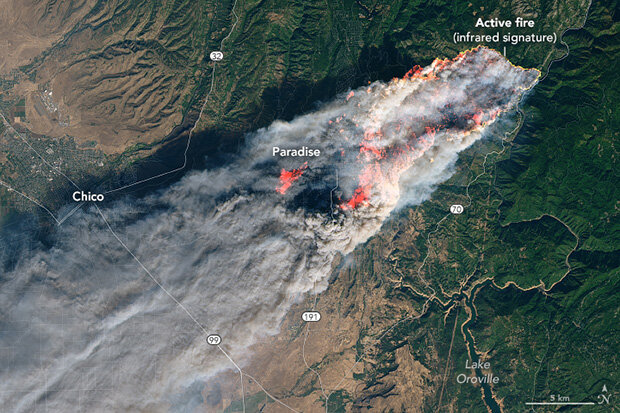
The Camp Fire, east of Chico, California. The image was captured by NASA's Landsat 8 satellite on November 8, 2018, around 10:45 a.m. local time (18:45 Universal Time). The image was created using Landsat bands 4-3-2 (visible light), along with shortwave-infrared light to highlight the active fire. Image from NASA's Earth Observatory.
In the last 2 years, U.S. wildfires have caused unprecedented damage, with losses exceeding $40.0 billion. To put 2018 in perspective, consider that 2017 established a new record for annual U.S. wildfire cost: $18 billion. That 2017 record was triple the previous record for U.S. annual wildfire season cost—$6 billion (CPI-adjusted), which occurred in 1991. The fire damage costs in 2018 are estimated at $24 billion, which exceeds the average damage costs of a landfilling U.S. hurricane ($21.9 billion).
In addition to the historic California wildfires, many other wildfires burned across several western and northwestern states. Similar to 2017, these wildfire conditions were enhanced by the preceding drought conditions. Sadly, dozens of lives were lost during the wildfire season. Ominously, the Camp Fire was the deadliest U.S. wildfire in over 100 years (i.e., Moose Lake and Cloquet Fires of October 1918). Of note, 15 of the 20 largest California wildfires (in acreage) and 15 of the 20 most destructive wildfires (buildings destroyed) have occurred since the year 2000, as tracked by Cal Fire.
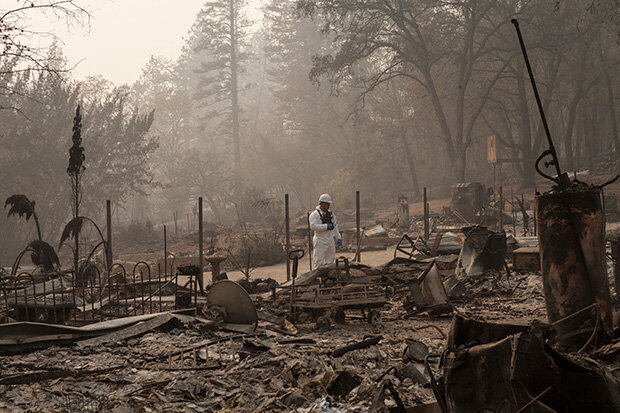
U.S. Army Sgt. Rodrigo Estrada of the California Army National Guard's 649th Engineer Company, 579th Engineer Battalion, 49th Military Police Brigade, from Chico, California, leads a team conducting search and debris clearing operations, Nov. 17, 2018, in Paradise, California. Photo courtesy California National Guard, used under a Creative Commons license.
Hurricane Florence (September 13-16, 2018)
Hurricane Florence was a large and very slow moving hurricane that produced extreme rainfall across eastern North Carolina (up to 35.93") and South Carolina (up to 23.81"). Florence made landfall as a Category 1 hurricane at Wrightsville Beach, NC, with damaging storm surge up to 10 feet and wind gusts reported over 100 mph. However, the majority of the damage caused by Florence was due to the rainfall inland, which caused many rivers to surpass previous record flood heights.
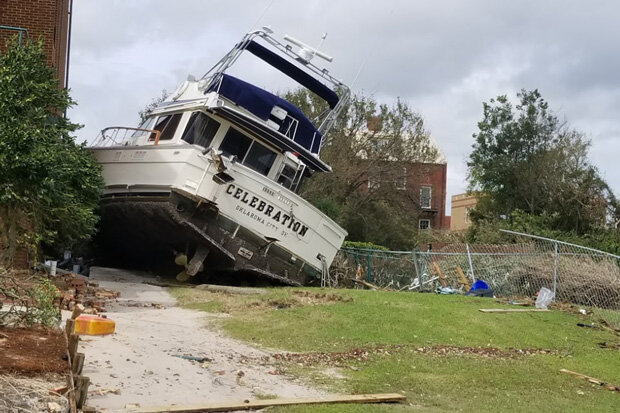
Some of the aftermath of storm surge from Hurricane Florence: a boat pushed inland onto high ground. Photo courtesy the Morehead City National Weather Service Forecast Office.
U.S. Marine base Camp Lejeune in North Carolina also suffered extensive damage that will cost billions to repair. The total damage from Florence in North Carolina is more than the cost experienced during Hurricane Matthew (2016) and Hurricane Floyd (1999) combined.
Hurricane Michael (October 10-11, 2018)
Powerful Category 4 Hurricane Michael made landfall at Mexico Beach, Florida, with devastating winds of 155 mph and storm surge in excess of 15 feet. Mexico Beach was nearly destroyed, while Panama City suffered extensive damage. Florida's Tyndall Air Force Base also suffered a direct strike from Michael's most intense eyewall winds causing billions in damage. Michael's intense winds reached well inland, causing billions in damages to agriculture and forestry, as high winds hit during harvest season for numerous crops across several states.
Michael was a rapidly developing hurricane that continued intensifying all the way until landfall thanks to above-average sea surface temperatures and low wind shear. Unusually, Michael also began re-intensification while crossing North Carolina far inland; it exited across Virginia into the Atlantic at near hurricane strength. Michael was the third Category 4 storm to make landfall in the contiguous U.S. in the last 2 years, and the fourth Category 4 storm to make landfall on the U.S. mainland or Caribbean territories since 2017, both of which are new U.S. records.
Looking at the bigger picture
One of the most striking comparisons among U.S. billion-dollar disasters over the last three years is the brutal series of hurricane impacts. From 2016-2018, the U.S. was impacted by 6 separate billion-dollar hurricanes (i.e., Matthew, Harvey, Irma, Maria, Florence, Michael) with an inflation-adjusted loss total of $329.9 billion and 3,318 fatalities. As a comparison, the U.S. also experienced a series of active hurricane seasons from 2003-2005 where 9 separate billion-dollar hurricanes (e.g., Charley, Ivan, Katrina, Rita, Wilma, etc.) made landfall, with an inflation-adjusted loss total of $298.6 billion and 2,225 fatalities. These losses are a reminder that individually, hurricanes have historically been the most damaging and costly weather events to affect the United States.
Even so, there is no modern comparison regarding the scale and cost of the 2017 and 2018 Western wildfire seasons. In total, over 18 million combined acres burned in 2017 and 2018, with costs in excess of $40 billion. The total U.S. wildfire costs for the last two years is roughly equal the costs of the previous 37 years combined (1980-2016). On average U.S. wildfire seasons have caused damage on the order of $1.0-2.0 billion annually.
Distribution of costs and fatalities by disaster type
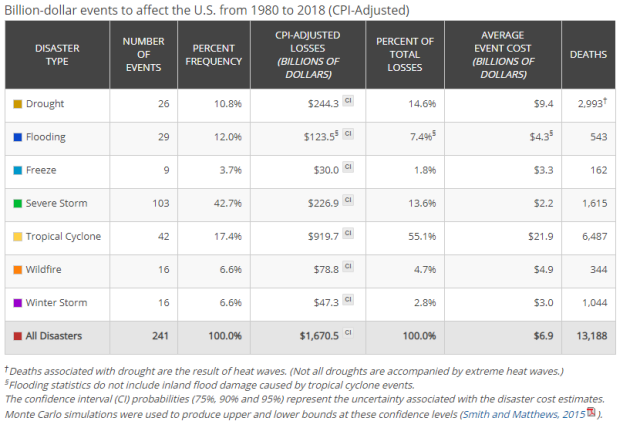
The distribution of damage from U.S. Billion-dollar disaster events from 1980 to 2018 (as of January 7, 2019) is dominated by tropical cyclone losses. Tropical cyclones have caused the most damage ($919.7 billion, CPI-adjusted) and also have the highest average event cost ($21.9 billion per event, CPI-adjusted). Hurricanes are responsible for slightly more than half (55.1%) of the total losses for all the U.S. billion-dollar disasters but represent less than one-fifth (17.5%) of all the billion-dollar events we have assessed since 1980. This total now includes the cost estimates for Hurricanes Florence and Michael that caused severe impacts across numerous Southeastern states.
Breakdown, by hazard type, of the 241 billion dollar weather and climate disasters assessed since 1980
Drought ($244.3 billion, CPI-adjusted), severe storms ($226.8 billion, CPI-adjusted) and inland flooding ($123.5 billion, CPI-adjusted) have also caused considerable damage based on the list of billion-dollar events. Severe storms have caused the highest number of billion-dollar disaster events (103), while the average event cost is the lowest ($2.2 billion, CPI-adjusted). Tropical cyclones and flooding represent the second and third most frequent event types (42 and 29), respectively. Tropical cyclones are responsible for the highest number of deaths (6,487), followed by drought/heatwave events (2,993), and severe storms (1,615).
The rising frequency of billion-dollar disaster events
The U.S. has experienced a rising number of events that cause significant amounts of damage. From 1980–2018, the annual average number of billion-dollar events is 6.2 (CPI-adjusted). For the most recent 5 years (2014–2018), the annual average is 12.6 events (CPI-adjusted).
The increase in population and material wealth over the last several decades are an important factor for the increased damage potential. These trends are further complicated by the fact that many population centers and infrastructure exist in vulnerable areas like coasts and river floodplains, while building codes are often insufficient in reducing damage from extreme events.
Climate change is also paying a role in the increasing frequency of some types of extreme weather that lead to billion-dollar disasters—most notably the rise in vulnerability to drought, lengthening wildfire seasons in the Western states, and the potential for extremely heavy rainfall becoming more common in the eastern states. Each of these changes in extremes are becoming more visible in relation to the influence of climate change (NCA 2018).
The geography of billion-dollar disaster events by type
The U.S. is weather and climate conscious for good reason, as each geographic region faces a unique combination of persistent hazards. The maps below reflect the frequency with which each state has been part of a billion-dollar disaster event (i.e., the totals do not mean that each state alone suffered $1 billion in losses for each event).
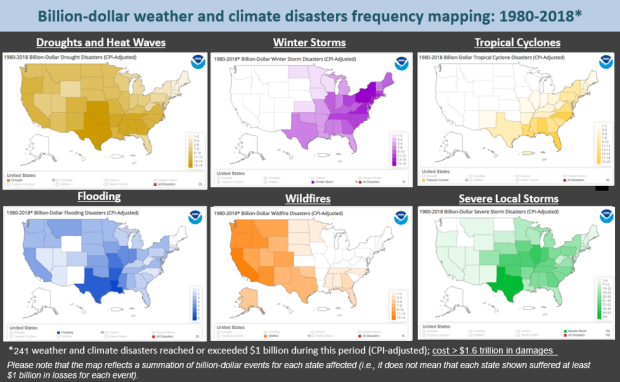
Maps depicting the number of times each state has been affected by each of six types of billion dollar weather and climate disasters. Note that each state did not necessarily experience a full billion-dollar cost for an event to be counted; it only needed to be part of a regional event that caused one billion dollars or more in direct damages.
Each disaster type has a distinct footprint of impact over time. We see wildfire impacts largely west of the Plains states, including a few Southeast impacts. However, the most intense and destructive wildfires occur in California–most notably after the year 2000.
There is also a high frequency of inland flooding events that occur in states adjacent to large rivers or the Gulf of Mexico, which is a warm source of moisture to fuel rainstorms. Drought impacts are mostly focused in the Southern and Plains states where there are billions of dollars in agriculture and livestock assets.
Crop freeze events have become more sporadic since the early 1990s, but these events can still cause considerable damage in the fruit-producing states of California, Florida, and other southeastern states such as Georgia and South Carolina.
Severe local storm events are common in the Plains and into the Ohio River Valley states. Winter storm impacts are concentrated in the Northeast, not surprising given the propensity for Nor’easters, while tropical cyclone impacts range from Texas to New England, but also include many inland states, often as a result of extreme rainfall and inland flood damage.
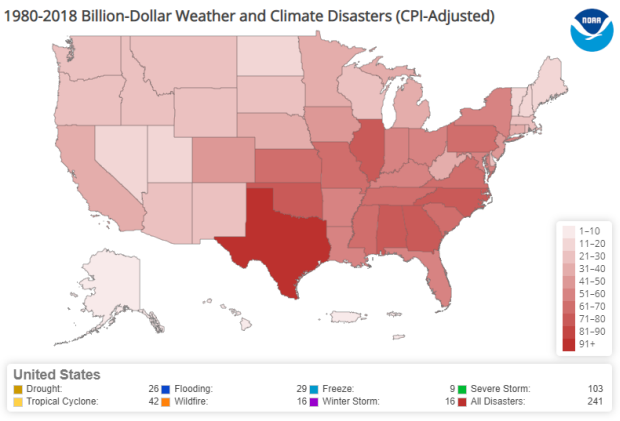
The number of billion dollar weather and climate disasters affecting each state, since 1980, regardless of hazard type. Note that each disaster did not necessarily cause one billion dollars in damages in an individual state to be included in this total.
In total, from 1980–2018, the U.S. South/Central and Southeast regions experienced a higher frequency of billion-dollar disaster events than any other region, as shown in the red total disaster frequency map. The South region has also suffered the highest cumulative damage costs reflecting the cumulative diversity, frequency, and severity of weather and climate events impacting these regions.
Each state has been affected by at least 1 billion-dollar disaster since 1980. Texas has experienced the highest number of events (104) and is one of the few states that have been impacted by all seven types of the billion-dollar disasters we analyze.
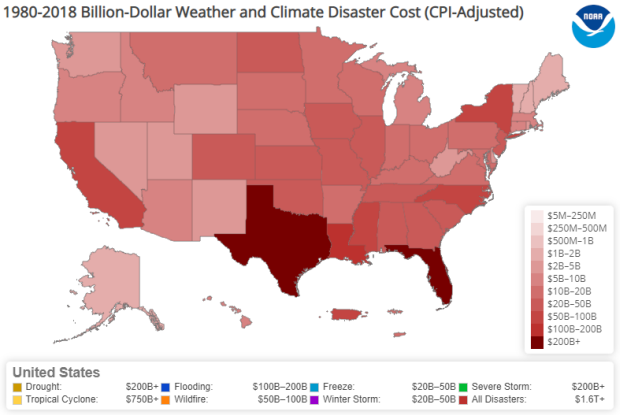
Total estimated cost borne by each state, from billion dollar weather and climate events.
The South/Central and Southeast regions of the U.S., including the Caribbean U.S. territories, have suffered the highest cumulative damage costs reflecting the severity and widespread vulnerability of those regions to a variety of weather and climate events. In addition to the highest number of billion-dollar disasters experienced, Texas also leads the U.S. in total cumulative costs (~$250 billion) from billion-dollar disasters since 1980. Florida is the second-leading state in total costs since 1980 (~$225 billion), largely the result of destructive hurricane impacts.
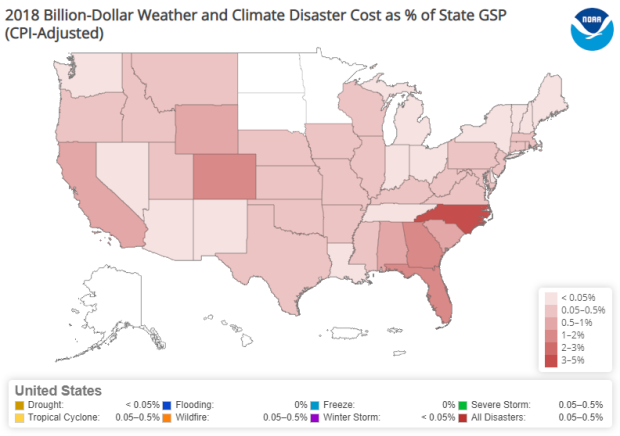
2018's billion dollar disaster costs, as a percent of Gross State Product.
Another way to examine damage is to compare each state’s annual disaster losses relative to their Gross State Product (GSP), which represents economic output. In 2018, North Carolina experienced the highest disaster costs in 2018 when compared with its 2018 GSP, which was 3%-5%. The majority of North Carolina’s losses resulted from Hurricane Florence. Florida and Georgia also had impacts in the 2%-3% of GSP range from the impacts from hurricane Michael.
Comments
Omitted relevant data
RE: Omitted relevant data
Hi Josh, I thought one of our experts was going to respond to you, but it's been a scramble for them trying to get caught up from the government shut down, so they must not have yet had time. My take is that if the point of these annual billion dollar disaster reports was to explain the causes of weather and climate disasters, then of course, they would have to do much more involved land cover/urbanization and population/social analyses in order to say anything meaningful about that.
But the purpose of these reports is simply to provide a tally of the number and annual costs of the country’s most significant disasters using a methodology that is consistent enough for us to be able to compare one year with another. So, if they were trying to attribute the definitive cause of an observed increase in the cost of BDD in a given location, then yes, it would certainly matter whether a given area had urbanized or not. But for basic score-keeping, that wouldn’t matter: a billion dollars in damage is a billion dollars in damage no matter what the land cover is.
RE: RE: Omitted relevant data
RE: RE: RE: Omitted relevant data
RE: RE: RE: RE: Omitted relevant data
FireProof, WaterProof, EarthquakeProof Buildings
Restoring Earth Biosphere Strong needs to be Absolute Focus
You didn't normalize data over time & in your flawwed article
RE: You didn't normalize data over time
I have not seen any peer-reviewed economic studies indicating extreme weather costs are trending lower. Please share those complete references with our readers; I am sure many will be interested. I am not an economist, but I thought that adjusting all losses to the consumer price index, as the NOAA analysis does, is indeed a commonly used economic technique to normalize costs that have been incurred in different time periods.
But even if I were to accept that your point is true--that relative to GDP, the cost of extreme weather losses has gone down--it doesn't follow that statistics such as NCEI keeps about the rising absolute costs of such disasters are "worthless." For one thing, such statistics would serve as the basis for more sophisticated analyses.
But also, from a public policy perspective, it's useful to know that the absolute costs of natural disasters are rising: billions of dollars in damages are still billions of dollars in damages, and they sap growth from the economy. Even if it's true that growth in other areas has been enough to offset those losses, it would still be still better for the economy if the absolute costs of disasters went down, not up.
RE: You didn't normalize data over time & in your...
RE: RE: You didn't normalize data over time & in your...
I'm not sure who this comment was directed to, but if you are referring to the NCEI analysis, you can find additional info, including a table of events that can be sorted in various ways, as well as the list of peer-reviewed publications that describe the details of the analysis, at the following URL:
https://www.ncdc.noaa.gov/billions/events
great report to build off of
Could I look at the data
RE: Could I look at the data
Data are available here: https://www.ncdc.noaa.gov/billions/events
RE: RE: Could I look at the data
Posting this response for Deke Arndt:
The Consumer Price Index is one way to account for inflation. CPI-adjusted effectively means 'accounting for inflation.' We apologize for the site being down; we anticipate it returning Monday.
Comments have been disabled on this article