March 2015 ENSO discussion: El Niño is here
Over the last several months, we’ve seen warmer-than-average sea surface temperatures (SSTs) in the tropical Pacific, including the Niño3.4 region, which we track as one indicator of El Niño. The seasonal Niño3.4 Index has been at or above 0.5°C since September, and the most recent weekly Niño3.4 index was +0.6°C.
The El Niño/Southern Oscillation (ENSO) is a coupled phenomenon, though, so we also monitor the atmosphere for signs that it is responding to those positive SST anomalies. For the last few months, we’ve been seeing some suggestions of borderline atmospheric El Niño conditions, but until this month we were below that borderline. This month, we’ve finally crept above it, and thus NOAA is declaring the onset of El Niño conditions.
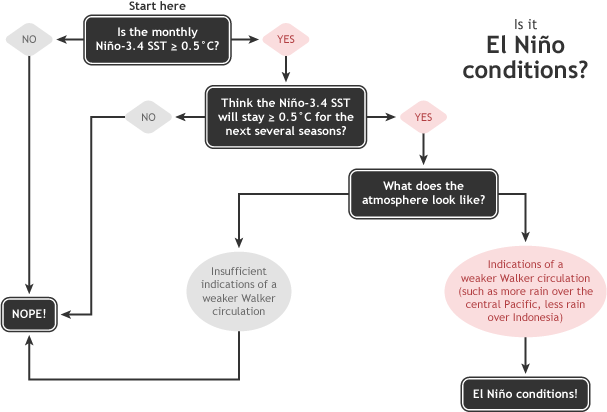
Summary of NOAA decision process in determining El Niño conditions. NOAA Climate.gov drawing by Glen Becker and Fiona Martin.
What tipped us over the line?
What’s different this month? For starters, it’s the second month in a row with a negative value for the Equatorial Southern Oscillation Index (EQSOI, -0.5 for February), one indicator of a weakened Walker Circulation. Also, the pattern of below-average rainfall in the central Pacific, which was very inconsistent with El Niño, recently transitioned to near-average rainfall (as indicated by outgoing longwave radiation). The increased rainfall we were seeing in the western equatorial Pacific continued.
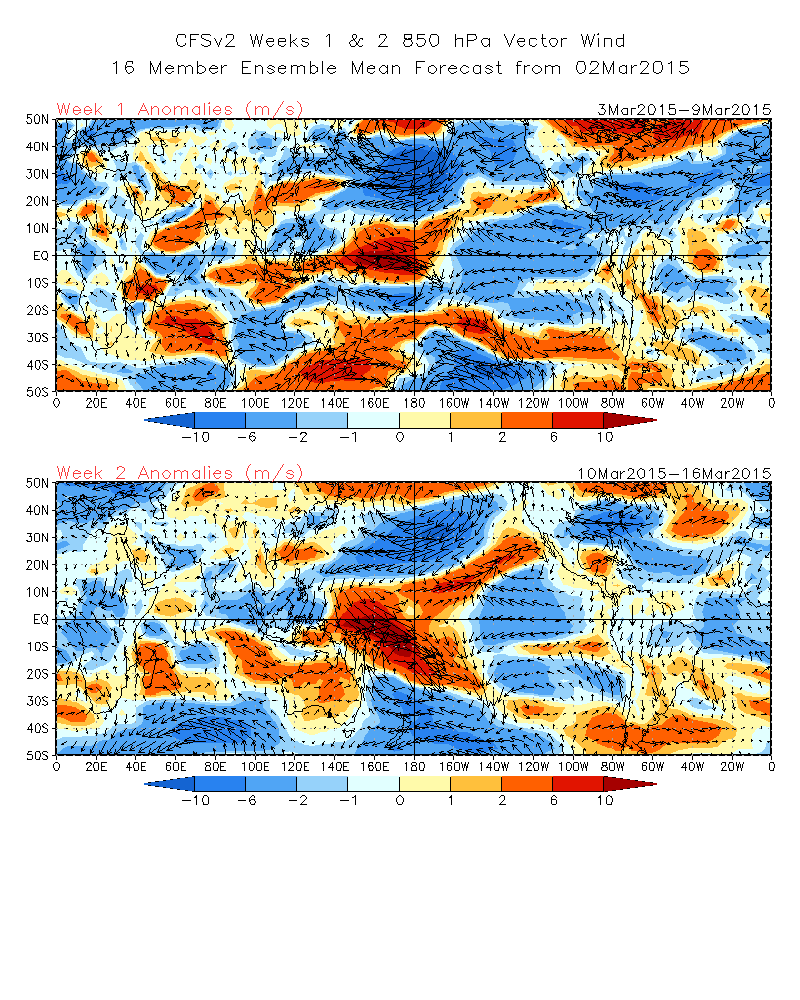
Late January and February saw a couple of westerly wind bursts over the central tropical Pacific, and the forecast for the first two weeks of March suggests these winds will continue. When the winds in this region turn more westerly, they can encourage movement of warmer surface waters eastward and either trigger or strengthen downwelling Kelvin waves, leading to warmer SST anomalies in the central and eastern parts of the tropical Pacific.
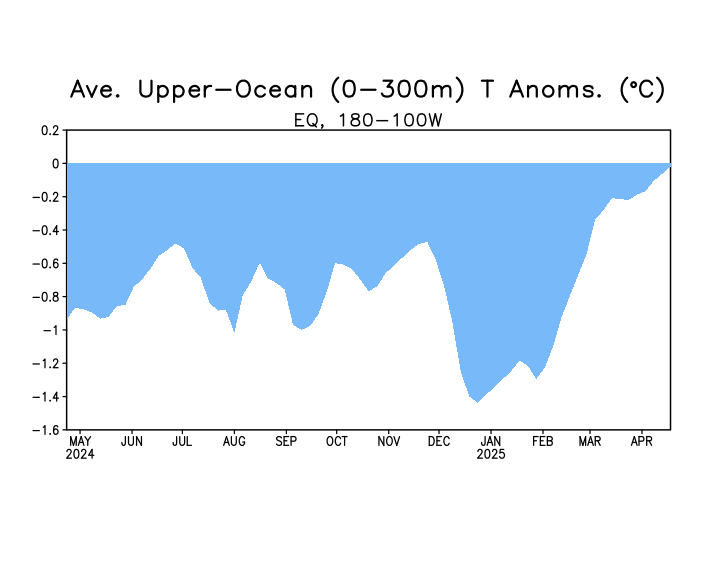
Also, over the last month, we saw an increase in sub-surface heat content and the growth of a moderate downwelling Kelvin wave. This suggests that there is likely to be a continuing source of warmer-than-average ocean temperatures for the next couple of months, potentially encouraging the continuation of the weak atmospheric coupling.
On the other hand—showing that we are still very close to the borderline—the Tahiti - Darwin SOI, another indicator of ENSO (though farther off the equator compared to the EQSOI), was +0.2 for February. Also, the “near average” rainfall in the central Pacific combined with above-average rainfall in the western Pacific is not a strong indication of El Niño conditions. As we’ve discussed before, a strong signal would be above-average rainfall in the central and eastern Pacific, and below-average rainfall over Indonesia.
Going forward, we will need to continue to monitor whether pressure and rainfall across the equatorial Pacific remain consistent with El Niño conditions.
But what does it mean for North American and global weather?
At this time, these are extremely weak El Niño conditions, during a time of year when the influence of El Niño on weather patterns in North America or other locations outside of the Tropics is weakening. For example, historical precipitation patterns associated with El Niño show that only about 3 of the past 10 El Niño years exhibited above-average rainfall in California during March-April-May (map pair below). Another way of looking at the historical relationships shows that ENSO has very little correlation to precipitation over North America during the spring.
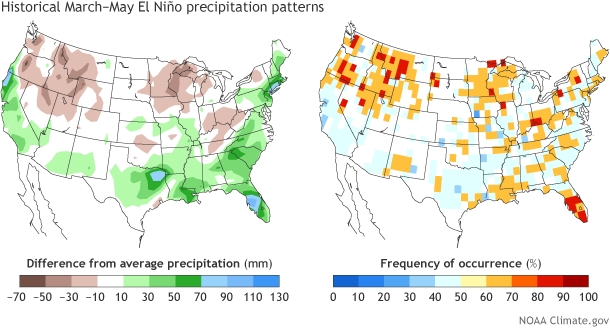
Difference from average March-May precipitation (left) and how often that anomaly occurred (right) during ten El Niño years between 1953 and 2010. NOAA Climate.gov graphic by Fiona Martin, based on data provided by Emily Becker, Climate Prediction Center. (See our featured image for more explanation on how to interpret these maps.)
The current warm SST anomalies are greatest in the Central Pacific (see map below). ENSO events centered in this area tend to be weaker (see Michelle’s post on ENSO flavors for more on this).
Especially since the rainy season in the West is winding down by March, it is unlikely that these current El Niño conditions will lead to substantial, drought-breaking rains.
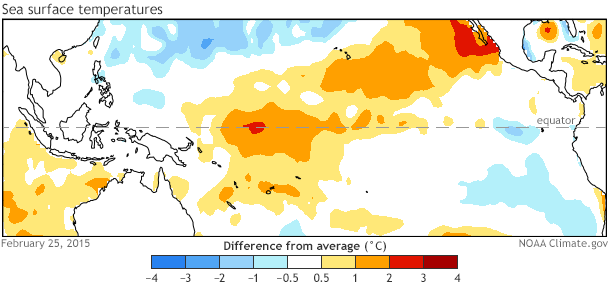
Sea surface temperature departures from average (based on 1981-2010) at the end of February 2015. NOAA map by Emily Becker, Climate Prediction Center.
What’s to come?
The CPC/IRI consensus forecast calls for an approximately 50-60% chance that El Niño conditions will continue through the spring. In the ocean-atmosphere coupling indicative of El Niño, warmer waters lead to atmospheric changes, and those atmospheric changes in turn help maintain the warmer water. So, it’s possible that even the weak coupling we’re seeing now will support the continuation of the positive SST anomalies. As I mentioned above, the recent westerly wind anomalies and the downwelling Kelvin wave will also help to keep the SSTs above average for the next few months.
Dynamical climate models are mostly forecasting a slow increase in the Niño3.4-region SST anomalies throughout 2015. Springtime is a difficult time of year for forecasting, as models traditionally have some difficulty seeing beyond the so-called “spring barrier,” and so the CPC/IRI consensus forecast probabilities decrease somewhat going into the summer, as forecast confidence decreases. That said, probabilities remain at or above 50% that El Niño conditions will continue through the fall.
After twelve months of El Niño Watches, we are issuing an El Niño Advisory. However, what it really represents is an incremental crossing of the borderline. If we follow the “Is it El Niño Conditions” flowchart, the warmer SST conditions, our anticipation that they will continue for the next several seasons, and signs of weak atmospheric coupling over the past month, mean we arrive at “yes!” From an impacts perspective, this is not particularly momentous, as El Niño impacts are weak in the spring and summer. Still, after months of hovering under the threshold, we can now say that El Nino conditions have arrived.
Comments
climate change for North America
RE: climate change for North America
Check out our blog post that will be issued this week, which will suggest one factor for the pattern over the U.S. during the past two winters.
RE: climate change for North America
RE: RE: climate change for North America
RE: RE: RE: climate change for North America
Thanks for your comment! You are right that Greenland Blocks (areas of high pressure near Greenland that help to "bunch up" the atmospheric flow in the eastern US and Europe) do have an impact on northeastern snowfall. However, at least for this year, we have not seen much in terms of a Greenland block. We would see that as a negative sign of the North Atlantic Oscillation (NAO). The NAO has been positive since late December.
Instead, it is a block in the north Pacific which has helped set up the atmosphere downstream that ended up causing the series of snowstorms that helped Boston set its all-time snowiest winter record.
RE: climate change for North America
EL Nino conditions not yet fullfilled
RE: EL Nino conditions not yet fullfilled
The use of the ONI is restrospective-- it is one simple index to categorize past historical ENSO episodes. We do not use it for our real-time, month to month updates because it would lag what is happening. For example, we would not wait until the end of 5 consecutive 3mo. overlapping seasons to say El Nino is here... otherwise we would be hopelessly behind the curve.
In our monthly updates, we issue an El Nino Advisory when we see *1-month* SST and atmospheric indexes consistent with El Nino. To issue an advisory, we also have to expect (>50% chance) that El Nino will continue. Here is an article documenting several of the indexes we consider:
http://www.climate.gov/news-features/blogs/enso/why-are-there-so-many-e…
February 2015 was the first month where we felt El Nino conditions were in place. The ONI might end up suggesting a start point that is earlier, but it is just one index based on one variable (SST only) and ENSO is a coupled ocean-atmosphere phenomenon.
The BOM's ENSO update
RE: The BOM's ENSO update
We also read the BOM perspective and value their assessments. And we know they are just as passionate and committed to "getting it right" as we are. However, because ENSO is a climate phenomenon based on multiple factors (variables like SST, winds, rain, pressure) and timescales, across a large expanse of the tropical Pacific, it is not easily boiled down to a single number and so divergences among various national agencies arise on occasion. This was touched on here:
http://www.climate.gov/news-features/blogs/enso/why-are-there-so-many-e…
The BOM recently issued an El Nino Watch because they saw some of the same factors as we did getting into place. However, they have slightly different criteria and thresholds than ours.
Finally, I should emphasize that this is not a clear-cut El Nino. It is weak and borderline. For this reason alone, I am not surprised different agencies would not all agree on its status. For those with a strong stake, I would encourage reading all ENSO assessments, which each lay out their reasoning, and coming to their own conclusions.
Isn't this an unusual layout for El Nino?
RE: Isn't this an unusual layout for El Nino?
ENSO comes in different flavors and types, which we addressed in an earlier blog post:
http://www.climate.gov/news-features/blogs/enso/enso-flavor-month
We find that the strongest El Nino events have above-average SSTs near Ecuador. However, weaker El Nino events often do not extend all the way to South America. The current case is weak and, as a result, we're not surprised to see it associated with characteristics that are more "Central Pacfiic."
One way to quickly compare different types is to compare the relative values of the Nino regions. Often the Nino-4 index is > Nino-3 index for weaker Central Pacific El Ninos and Nino-3 is > Nino-4 for stronger Eastern Pacific El Ninos. Data
Historical El Nino counterpart?
RE: Historical El Nino counterpart?
El Nino!
el niño in Chile
El Niño in Peru
Kelvin waves will arrive to Peruvian coast
Could "sunspot" CME cycles correlate with El Nino cycles?
RE: Could "sunspot" CME cycles correlate with El Nino cycles?
While I'd like to provide some references for you to check out, the reality is that links between sun spots and El Nino, and really most types of climate phenomena have never stood the test of time, so at this point, sun spots are not something thought to play a role in the ENSO cycle.
El Nino in Ecuador
RE: El Nino in Ecuador
While not an expert in Ecuadorian weather and climate, the El Nino related rains that impact this part of South America typically occur later in the year (December), potenially extending through March, April, or even May.
El Niño en Ecuador
RE: El Niño en Ecuador
This website is very useful for viewing when El Nino and La Nina events have occurred since 1950. You will see that we have had a few El Nino events (red/rojo) and a few La Nina events (blue/azul) since 2009.
Comments have been disabled on this article