December's ENSO Update: Close, but no cigar.
The first Thursday of every month is when we do the CPC/IRI ENSO status update, when NOAA officially answers the question “Are we there yet?” This month, the answer is...close, but no cigar.
Sea surface temperatures (SSTs) in the Niño3.4 region of the Pacific were quite warm during November, with the most recent weekly Niño3.4 index value at +1.0°C above average. The threshold for El Niño conditions is +0.5° above average for one month, and most of the climate models are forecasting that SSTs will stay above average for at least a few more months. Then why haven’t we changed from an “El Niño Watch” (favorable for development of El Niño conditions) to an “El Niño Advisory” (El Niño conditions are present)?
The atmosphere just won’t get with the program
First, a quick review of what we mean by “El Niño conditions.” There are three components:
(1) A one-month SST anomaly of +0.5°C or greater in the Niño3.4 region (check!),
(2) An expectation that the warm SSTs will meet or exceed that threshold for the next few months (seems very likely!),
(3) An atmospheric response typically associated with El Niño (not quite there yet).
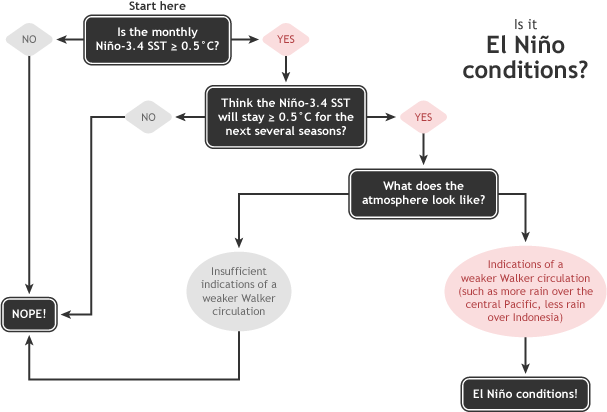
Summary of NOAA decision process in determining El Niño conditions. NOAA Climate.gov drawing by Glen Becker and Fiona Martin.
In a nutshell, the typical El Niño atmospheric response includes reduced rainfall over Indonesia, more rainfall over the central Pacific, and some weakening of the low-level easterly winds and upper-level westerly winds (the Walker circulation) along the equator. As of the beginning of this month, we have seen reduced Indonesian rainfall, but we have not seen more rain over the central Pacific (the opposite, in fact), and changes in the Walker circulation are unclear.
The most common way of looking at the rainfall patterns in the tropics is to use outgoing longwave radiation, which is monitored by satellites. Solar energy reaches Earth as shortwave radiation, is absorbed by the surface, and heats it up. The warmed surface then radiates longer-wavelength energy back out to space. This outgoing longwave radiation (OLR) is intercepted by clouds, so when the satellites see less OLR than average in a location, it was probably cloudier—and in the tropics, that means rainier—than usual there. And vice versa: more OLR means fewer tropical clouds and less rainfall.
Can we get a little more rain over here?
Figure 2 shows the average November OLR anomaly over the tropical Pacific. That big orange spot near the Date Line means higher OLR than average: fewer clouds and less rainfall. With El Niño conditions, we’d normally expect more rain than usual in this region, so the decreased rain tells forecasters that the atmosphere may not be adequately coupled to the warm SSTs yet. The presence of convection (storminess) in this region matters so much because this is how El Niño communicates between the equatorial Pacific and the higher latitudes, kicking off a cascade of global impacts.

Figure 2: Outgoing longwave radiation (OLR) departure from average for November 2014. Map by Emily Becker and Fiona Martin.
Another measurement also suggests we’re not quite in El Niño conditions: The Southern Oscillation Index (SOI; the surface pressure anomaly difference between Tahiti and Darwin, Australia) is in negative territory (-0.9), but the Equatorial SOI, which compares the pressure anomalies between the western and eastern equatorial Pacific, is near zero. With El Niño, we’d expect to see negative SOI, because that indicates a weakening of the Walker Circulation.
On the other hand, there is some orange over Indonesia in Figure 2, meaning fewer clouds and reduced rainfall, which is compatible with El Niño conditions. As well, November upper-level westerly winds and lower-level easterly winds were both slightly weaker than average. The atmosphere may be beginning to respond, but not convincingly enough for forecasters to declare an El Niño Advisory.
For some El Niño impacts, “close” is close enough
El Niño impacts can emerge in different parts of the globe, even if the NOAA definition hasn’t yet been formally satisfied. Different countries have different thresholds for El Niño, which are tailored to their specific interests.
For example, the Peruvian National Committee on El Niño Studies (ENFEN) declared a “moderate coastal El Niño” in May of this year; SST anomaly in the easternmost Niño1+2 region is the primary metric for their declaration of coastal El Niño. Their event peaked in July, and is still ongoing. Atmospheric coupling is not required for them to see impacts: the strong downwelling Kelvin wave in the spring and associated warm SSTs near the Peruvian coast reduced the spatial distribution of anchovies, an important fishery for Peru.
What next?
Recently, the observed increase in SST anomalies has generally matched up well with forecasts from most climate models. The August, September, and October forecasts from the NMME predicted a November Niño3.4 SST anomaly between +0.7°C and +0.9°C. Due to the recent warming and our expectation that ocean temperatures will continue to be above-average, forecasters this month have again increased the odds of El Niño this winter to an approximately 2-in-3 chance.
Comments
Brilliant
Sometimes a Cigar is Just a Cigar
RE: Sometimes a Cigar is Just a Cigar
You're right, but it would be really impractical to issue a forecast and assessment every week.
el nino and my winter trip
Zambia
Eastern Pacific SST Anomoly
ENSO 2014_15
RE: ENSO 2014_15
You're right that one region in the Pacific can have different results from another region. The Nino3.4 region has historically had the highest correlation with the ENSO-related changes in atmospheric circulation that we're interested in, so that's why we use that as our primary index.
forecast
December's ENSO Update: Close, but no cigar. Author: Emily Becke
snow
RE: snow
The southeastern half of Maryland does have a slightly increased chance of more precipitation than average... but snow is very hard to predict. This is especially so in Maryland, where the winter temperature can hover right around freezing, and a degree or two can make the difference between a rainy day and a snowstorm.
El Nino Winter
Is a super niño coming?
EN and upper air changes
The (big) little guy
Rainy Pacific Northwest
Add new comment