ENSO Flavor of the Month
No, we’re not just talking about ice cream in this post (mmm…. yum), but about the different types, or flavors, of the El Niño-Southern Oscillation (ENSO). These different flavors of ENSO are usually based on the location where tropical Pacific sea surface temperature (SST) anomalies are the largest. There is debate on whether differences in the cold state of ENSO, La Niña, can be classified (1), so we’ll leave that alone for now and focus on the warm state, El Niño.
El Niño can take on a wide range of flavors, but here we show two examples of El Niño winters that are at opposite extremes:
(1) Eastern Pacific El Niño (a.k.a. Cold Tongue, Conventional, or Canonical El Niño):
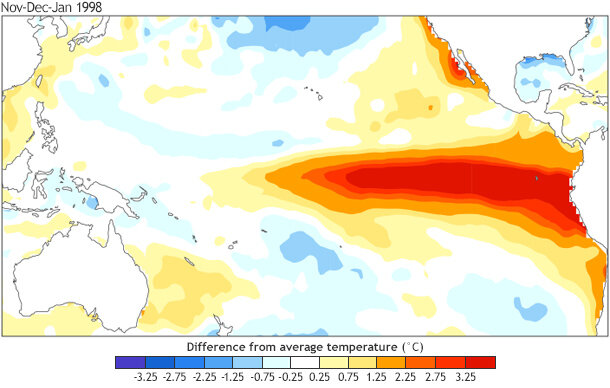
Sea surface temperature anomalies (departures from average) during November 1997- January 1998. Data based on OISSTv2 and using a 1981–2010 base period.
(2) Central Pacific El Niño (a.k.a. Modoki, Warm Pool, or Dateline El Niño)
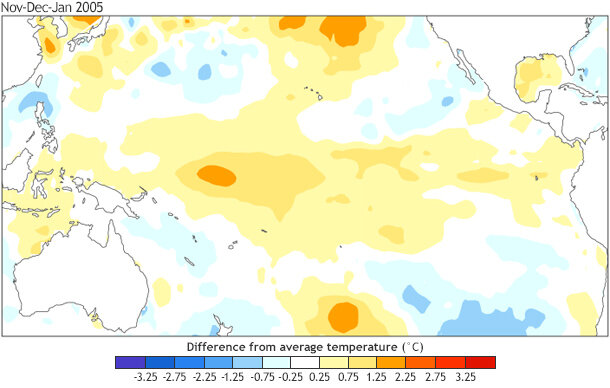
Sea surface temperature anomalies (departures from average) during November 2004–January 2005. Data based on OISSTv2 and using 1981–2010 base period.
Above, it is pretty clear that above-average sea surface temperatures (SSTs) are largest in the central Pacific during the 2004-05 El Niño and in the eastern half of the Pacific during the 1997-98 El Niño. However, some El Niño cases aren’t easily defined by these two categories. Take, for example, the 2009-10 El Niño:
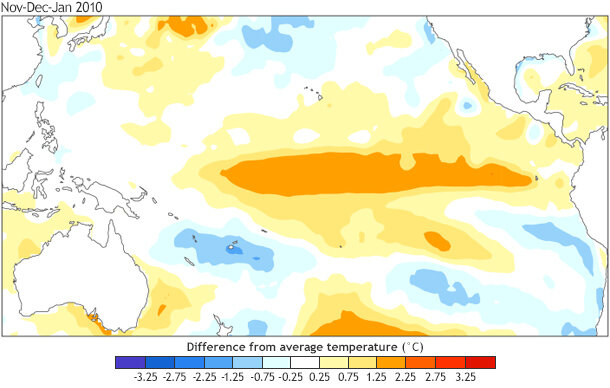
Sea surface temperature anomalies (departures from average) during November 2009–January 2010. Data based on OISSTv2 and using 1981–2010 base period.
In this case, the above-average SSTs were strongest closer to the central Pacific, but the above average SSTs still stretched all the way to South America. In fact, one measure (2) shows November 2009 – January 2010 mapped onto both flavors of El Niño almost equally, so it was difficult to neatly categorize.
Scientists (Capotondi et al., in press; Giese and Ray, 2011; Johnson, 2013) corroborate this perspective by noting that flavors may come in a continuum of different types—more than just the two above! As it turns out, even within the span of a single event, the location of SST anomalies can shift around and take on different flavors (Karnauskas, 2013).
In the maps above we are showing you only one season (November-January), when ENSO is usually at its peak, but nearby months and seasons can have different SST patterns. It’s like going into an ice cream shop and realizing that there aren’t just chocolate and vanilla flavors, but all the ones in between: chocolate-vanilla ripple, chocolate chip vanilla ice cream, cookies and cream, etc. (you can imagine where I’m headed after I finish writing this).
Okay, so now I’ve explained how El Niño can be like a Baskin Robbins, but who cares? Well, as we’ve explained in previous posts, what happens in the Pacific often doesn’t stay in the Pacific (here, here, here). There is some evidence that these different flavors of ENSO can lead to different impacts in temperature and rainfall over the globe (3). For example, Tom previously discussed differences in the Indian Monsoon based on the pattern of SSTs across the tropical Pacific. Over coastal Ecuador and Peru, a weaker, more Central Pacific El Niño may not lead to the heavy rainfall and flooding that an Eastern Pacific event may cause (e.g. Hu et al., 2012).
Finally, you might have noticed the NOAA CPC/IRI ENSO updates don’t say which type of event is expected, and, in part, this is due to this continuum of flavors that change over time as SSTs vary in location. But the updates do contain a description of where the SSTs are warmer, which provides a hint on the flavor. The Niño-4 SST region is often more above-average than Niño-3 during a Central Pacific event and vice versa during an Eastern Pacific event (see slide no. 5 of the briefing).
Also, there is strong evidence that the location of the maximum SST anomaly is tied to ENSO strength. Check out this figure by NOAA GFDL scientist Andrew Wittenberg who looked at a 4,000 year run of ENSO in the CM2.1 model, showing the relationship between the strength of the El Niño and its dominant location:
Scatterplot of the relationship between the maximum sea surface temperature anomaly (y-axis) and its location in the equatorial Pacific Ocean (x-axis showing longitude). Data is based on a 4,000 year pre-industrial control run of the NOAA GFDL CM2.1 model. Figure courtesy of Andrew Wittenberg and modified by climate.gov.
In general, it shows that the farther east the location of largest SST anomalies is (farther right on the horizontal axis), the stronger the event (higher on the vertical axis). As the location of the biggest anomalies shifts toward the central tropical Pacific, the SST anomalies become weaker. In other words, ENSO strength and ENSO flavors go hand in hand (4).
This relationship brings us to a rule-of-thumb:
Weaker El Niños tend to be closer to the Central Pacific types and stronger El Niños tend to be closer to Eastern Pacific types.
Like all rules-of-thumb, this one will not apply to every case (in the figure above, notice the smaller cluster of weak El Niños that also peak in the eastern Pacific), but it will work for the majority of them.
At this time, the NOAA CPC/IRI ENSO forecasting team favors a weak event, which is an implication that if an El Niño forms, the sea surface temperature anomalies will mostly resemble a “Central Pacific” El Niño. Sure enough, some of the indicators over the past month show that SSTs were warmer near the Date Line. However, if the event strengthens, then we could see more coherent, widespread warmth across the eastern Pacific—vanilla may start taking on some chocolate fudge.
Footnotes:
(1) Some scientists have pointed out that tropical Pacific SST and rainfall anomalies associated with La Niña don’t have clear differences in appearance. Also, the different SST regions (Niño-4 and Niño-3) are more correlated during La Niña (Kug et al., 2009; Kug and Ham, 2011).
(2) There are many different indices or methods to define the two types of El Niño, but if the leading Orthogonal Functions (EOFs) of tropical Pacific SST anomalies are calculated, then two patterns that emerge resemble Eastern and Central Pacific El Niños (Ashok et al., 2007; L’Heureux et al., 2012). The corresponding standardized time series show November 2009 – January 2010 project nearly equally onto the two EOFs.
(3) It appears that stronger/Eastern Pacific El Niños are accompanied with more reliable impacts over the globe. This makes some intuitive sense: if the forcing (or pushing) from the tropical Pacific is greater, than the atmospheric circulation in the higher latitudes (i.e. over the United States) responds more and provide more classical and predictable El Niño impacts (e.g. Goddard and Dilley, 2005). However, weaker/Central Pacific events don’t demonstrate the same strong push onto the atmosphere, so impacts may vary more from event to event, especially as you move farther from the tropics. Also confounding matters is that dividing up El Niños into different categories leads to smaller numbers of cases, which are less statistically robust and subject to sampling error. With that said, there are several studies indicating that different impacts over the United States may occur based on different flavors/ categorizations of El Niño strength (e.g. Larkin and Harrison, 2005; Chiodi and Harrison, 2013).
(4) The observational record is shorter and results will depend on the index used, but in general, El Niño index values, as measured by the Niño-3.4 region or Oceanic Niño Index (ONI), tend to be smaller for Central Pacific winters and larger during Eastern Pacific winters.
References:
Ashok, K., S. K. Behera, S. A. Rao, H. Weng, and T. Yamagata (2007), El Niño Modoki and its possible teleconnection, J. Geophys. Res., 112, C11007
Capotondi, A., A. Wittenberg, et al., 2015: Understanding ENSO diversity Bull. Amer. Meteor. Soc., in press. (link)
Andrew M. Chiodi and Don E. Harrison, 2013: El Niño Impacts on Seasonal U.S. Atmospheric Circulation, Temperature, and Precipitation Anomalies: The OLR-Event Perspective*. J. Climate, 26, 822–837.
Giese, B. S., and S. Ray (2011), El Niño variability in simple ocean data assimilation (SODA), 1871–2008, J. Geophys. Res., 116, C02024
Lisa Goddard and Maxx Dilley, 2005: El Niño: Catastrophe or Opportunity. J. Climate, 18, 651–665.
Hu, Zeng-Zhen, A. Kumar, B. Jha, W. Wang, B. Huang, and B. Huang, 2012: An analysis of warm pool and cold tongue El Niños: air-sea coupling processes, global influences, and recent trends. Clim. Dynam., 38, 2017-2035.
Nathaniel C. Johnson, 2013: How Many ENSO Flavors Can We Distinguish? J. Climate, 26, 4816–4827.
Karnauskas, K. B. (2013), Can we distinguish canonical El Niño from Modoki?, Geophys. Res. Lett.,40, 5246–5251.
Jong-Seong Kug, Fei-Fei Jin, and Soon-Il An, 2009: Two Types of El Niño Events: Cold Tongue El Niño and Warm Pool El Niño. J. Climate, 22, 1499–1515.
Kug, J.-S., and Y.-G. Ham (2011), Are there two types of La Nina? Geophys. Res. Lett., 38, L16704.
L’Heureux, M.L., D.C. Collins, and Z.-Z. Hu (2013). Linear trends in sea surface temperature of the tropical Pacific Ocean and implications for the El Niño-Southern Oscillation. Clim. Dynam. 40, 1223-1236 (link).
Larkin, N. K., and D. E. Harrison (2005), On the definition of El Niño and associated seasonal average U.S. weather anomalies, Geophys. Res. Lett., 32, L13705.
Comments
ROT between strength and longitude
RE: ROT between strength and longitude
Good question and the answer is not clear to me. Research has indicated that *stronger Eastern Pacific* events engage the "thermocline" more, which basically means that the flow of colder water upwelling from the deep ocean becomes weaker (note: typically the waters off the coast of Ecuador/Peru are cooler than the rest of the tropical Pacfic Ocean). When that happens the eastern Pacific sea surface temperatures warm up, which reduces the east-west temperature gradient (see more on SST gradients here: http://www.climate.gov/news-features/blogs/enso/what%E2%80%99s-hold-el-…; ), which leads to the trade winds to weaken, which then reinforces the weaker upwelling zone. So, it's a big feedback loop and stronger El Nino's tend to have a stronger "thermocline feedback." So, if I were to speculate, I would guess that the cluster of weaker Eastern Pacific events doesn't trigger that thermocline feedback as strongly and might be more a reflection of wind driven surface currents.
Resulting CONUS Pcpn with Weak/Central vs Strong/Eastern El Nino
RE: Resulting CONUS Pcpn
As is lightly alluded to in the footnotes, we get nervous discussing United States impacts associated with different strengths/flavors of ENSO because of the smaller number of cases (sample size). Even a large AMIP ensemble with many members can have limitations because there are < 10 cases represented in the composite of SST anomalies. The AMIP is run using a **fixed SST pattern** and slightly different perturbations of the atmospheric state. So, while you can achieve a nice estimate of the U.S. signal-to-noise *assuming* the SST patterns accurately reflect weak and strong El Ninos, it doesn't say that the composited SST pattern itself -- or division of years into two categories -- is robust. Also, given the fact that the SST anomalies move around within each year, it makes it even harder to understand the consequences upon the U.S. In one month, it might look more like a central Pacific/weak event and then a couple months later it might have more of an eastern Pacific component. Your link to the most recent seasonal average map is fun to look at because I'm not sure how you would categorize an event that has anomalies in both the west-central and far eastern Pacific (if hypothetically the waters were warm enough). This underscores the point that it is not unusual to see SST patterns that lie *in between* the more extreme cases.
With all those caveats above, there is no harm in looking at the smaller composite of events as long as you remain aware of the case-to-case variability. When you have such a small sample to draw upon, I really recommend examining each case separately and not just simply averaging them together. If the impacts remain consistent across each individual case AND there is a plausible physical reason for that specific impact, then you can start to build a case that it may be meaningful.
Add new comment