February 2020 ENSO update: mind reading
The tropical Pacific is warmer than average, but it doesn’t meet El Niño criteria. Forecasters estimate about a 60% chance that ENSO-neutral conditions will continue through the spring, with a 50% chance of neutral through the summer. (ENSO = El Niño/Southern Oscillation, the whole ocean/atmosphere El Niño/La Niña system.)
If you’ve been paying close attention to the sea surface temperatures, you may have noticed that the Oceanic Niño Index, the three-month-average temperature anomaly in the Niño3.4 region, has now been above the El Niño threshold for two consecutive three-month periods, October–December and November–January. (Anomaly = departure from the long-term average.)
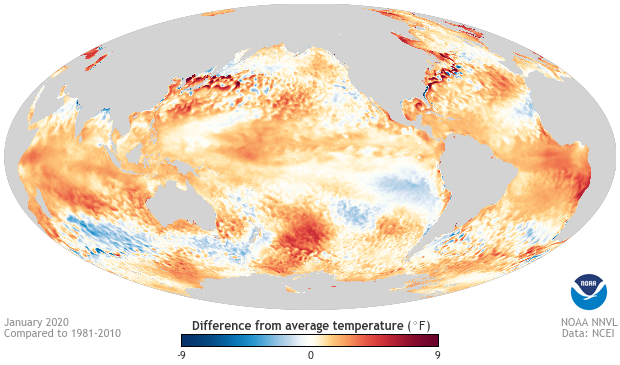
January 2020 sea surface temperature departure from the 1981-2010 average. Image from Data Snapshots on Climate.gov.
The forecast team considered the situation carefully and concluded that the current warmer Pacific Ocean doesn’t reflect El Niño conditions. Also, right now the most likely outcome (60% probability) through the spring is that ENSO will remain in neutral. Perhaps you’re wondering what we were thinking about when we developed our forecasts this month…
You read my mind
Have you ever wondered about the thought process of the ENSO forecaster? I hope so, because today I’ll take you into the mind of one! Well, into the mind of yours truly, since I’m not actually psychic. But, during our team discussions, one can get a pretty good picture of what the ten or so of us are all focusing on. Most of us have been studying the tropical Pacific, looking for clues about ENSO, for years—decades, in some cases—and we still find it interesting and full of surprises.
The first question on my mind each month is about the current conditions in the tropical Pacific Ocean. Do we meet the first criterion for El Niño conditions, as illustrated in our diagnostic flow chart?
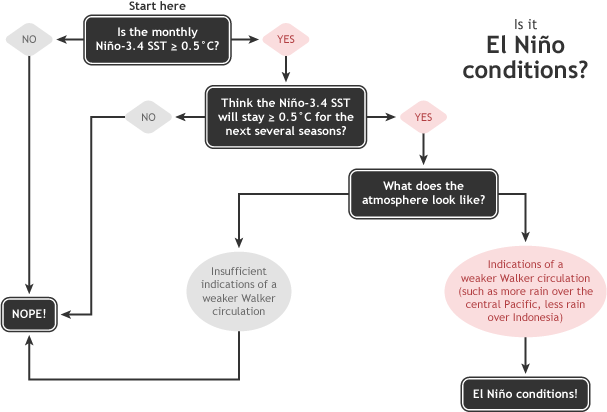
Summary of NOAA decision process in determining El Niño conditions. NOAA Climate.gov drawing by Glen Becker and Fiona Martin.
The Climate Prediction Center publishes a helpful weekly update on ENSO-related conditions in the ocean and atmosphere. First, I’ll check the Niño3.4 Index, the sea surface temperature in our primary ENSO-monitoring region—it’s been at or above the El Niño threshold (0.5°C above the long-term mean) for the past few months, so we pass the first box.
Then, to answer the question in the second box, “Think it’ll stay above the threshold for the next several months?” I’ll start with the climate model forecasts. Currently, most of these models are around the threshold for the next few months, but then the anomalies gradually shrink as we go into the spring. To add to the picture of the future of sea surface temperatures in the tropical Pacific, I’ll check on the temperature of the water under the surface of the tropical Pacific.
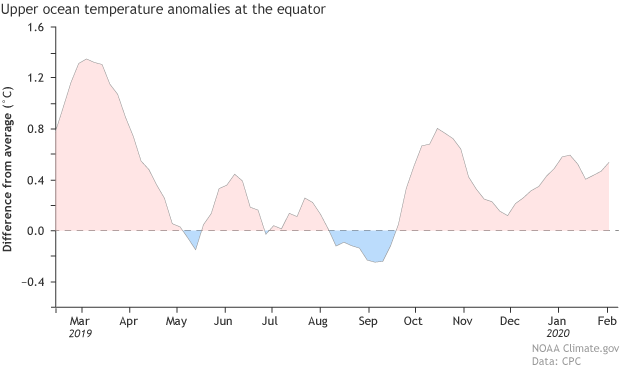
Area-averaged upper-ocean heat content anomaly (°C) in the equatorial Pacific (5°N-5°S, 180º-100ºW). The heat content anomaly is computed as the departure from the 1981-2010 base period pentad (5-day) means. Heat content increased has been elevated for the last few months. Climate.gov figure from CPC data.
It’s been above average lately, meaning there’s a source of warmth to supply the surface. It’s not hugely elevated, though—for example, during the weak El Niño last February, the subsurface temperature anomaly was twice as large. Overall, we’re leaning “no” on the second box of the flowchart.
Head in the clouds
Then I’m on to examining the atmospheric conditions, asking if there are any patterns in the winds or rain that suggest the atmosphere is responding to changes in the ocean surface temperature. Typically, air rises over the very warm water of the far western Pacific, around Indonesia, travels to the east high up in the atmosphere, descends in the eastern Pacific, and travels back west near the surface. This is the Walker circulation, as elegantly discussed by Tom lo these many moons ago.
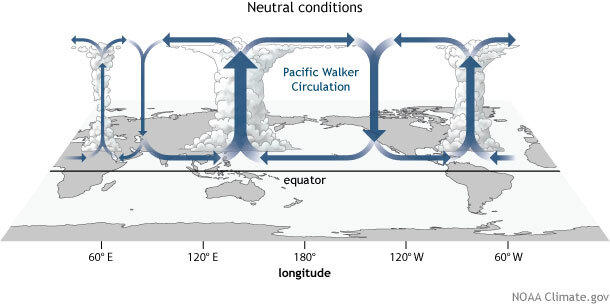
Generalized Walker Circulation (December-February) during ENSO-neutral conditions. Convection associated with rising branches of the Walker Circulation is found over the Maritime continent, northern South America, and eastern Africa. NOAA Climate.gov drawing by Fiona Martin.
To look for changes in the Walker circulation over the past month, I’ll examine the near-surface winds, which were blowing more west-to-east than normal in the western tropical Pacific over the past four weeks. Also, there was a bit more rain than average in the central Pacific. Both of these things can be consistent with El Niño conditions. However, the upper level winds were also more west-to-east than average in the eastern Pacific, which does not match up with El Niño conditions.
Other important measurements of the Walker circulation are the Southern Oscillation Index and the Equatorial Southern Oscillation Index, both of which were close to zero over the past month. Overall, it’s more likely that the near-surface winds and rain patterns were influenced by short-term weather variability recently, not the seasonal pattern that defines ENSO.
Brain waves
What else might contribute to warmer-than-average surface water in the tropical Pacific? Global warming and climate change due to human emissions of greenhouse gases is always on our minds, of course. The average temperature of the Niño3.4 region has increased by more than 0.5°C since 1950.
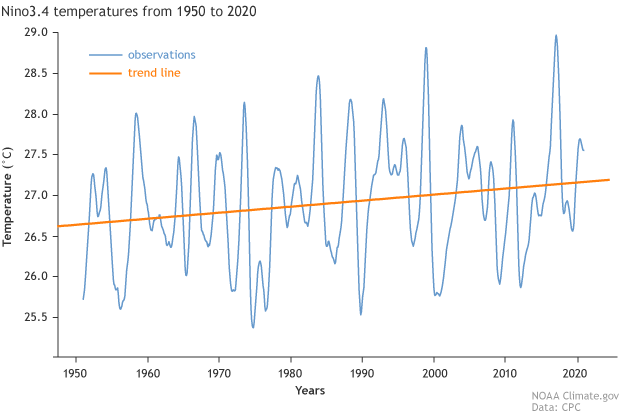
Temperature in the Niño3.4 region (5°S - 5°N latitude, 170°W – 120°W longitude) since 1950, using ERSSTv5 data. A 12-point running average has been applied to the monthly temperatures. Orange line shows the 1950 – 2020 trend. Climate.gov graphic from CPC data.
When computing Niño3.4 anomalies, we use an averaging period of the most recent 30-year period, updated every five years, to adjust to some of this warming trend. Right now, that averaging period is 1986–2015. Next year, we’ll update to 1991–2020. I’m running out of space to get into the hows and whys of this, but Climate.gov has a nice description here. Overall, though, the climate is warming rapidly, and that can have some effect on ENSO, particularly when we are getting close to updating the averaging period.
I’ll think about it and get back to you
If you’re in an ENSO state of mind, you know we’re on your wavelength! We're always closely monitoring the tropical Pacific and keeping you updated and informed.
Comments
0.5C
RE: 0.5C
Good question! We do not have plans to change the El Nino/La Nina thresholds at this time. As this document from the World Meteorological Organization indicates, most countries around the world use the same 0.5 deg. C threshold that we use. Also, a World Climate Research Programme working group of scientists decided upon the 0.5 deg. C threshold for at least five consecutive seasons, and that became the basis for NOAA's official definition. This persistence criterion is important because a few seasons in a row with a Nino 3.4 index above 0.5 deg. C or below -0.5 deg. C are usually (but not always) enough to see an ENSO atmospheric response. This also helps to emphasize why we do not put too much weight in the Nino 3.4 sea surface temperature for a single month - we need evidence that the value will persist above the threshold.
Your second question, if I understand it correctly, is a bit trickier to answer. I will start by saying that ENSO depends on feedbacks between the atmosphere and ocean. When the atmosphere is warmer, it is tougher to get an atmospheric response for a given sea surface temperature value, and so it might be useful to see how warm or cool the tropical atmosphere is for a given Nino 3.4 index value in order to see if an atmospheric response is more or less likely. However, in the bigger picture, we also have to consider changes in the ocean, and the patterns of ocean warming can have a big impact on how ENSO will change in a warmer world. The bottom line is that it's complicated. We have discussed some of the climate change science and challenges here, here, here, and here.
ENSO State of Mind
RE: ENSO State of Mind
I cannot offer a lot of insight, but it looks like there has been a persistent area of high pressure in the southern Tasman Sea and a trough of low pressure over eastern Australia that has funneled moist air into eastern Australia. It's a shame that it seems to be feast or famine when it comes to rainfall over Australia lately.
Neutral Phase - Central/Southern Plains
RE: Neutral Phase - Central/Southern Plains
The current setup is a bit different from what we saw in 2002-2003. Around this time in 2003, we were seeing the end of a weak El Nino. This year, we have seen more of a prolonged period of neutral conditions. Moreover, because ENSO neutral conditions don't provide the atmosphere much of a "push," the dominant factors affecting the Central/Southern Plains weather in April will likely be unrelated to ENSO. With that said, you can take a look at the CPC's latest thinking in the March - May 2020 seasonal outlook.
El Nino forecast models
RE: El Nino forecast models
Forecasts issued this time of year are typically among the lower skill forecasts. Given the fairly high degree of uncertainty, the large spread among the models is not too surprising. As far as improved accuracy, model forecasts prior to the spring barrier continue at times to be quite challenging.
Effect of ENSO phases on West-Africa subregion.
Current model forecasts for
Current model forecasts for March-May slightly favor wetter than average conditions for the Horn of Africa. Given that El Nino has not arrived, nor expected to intensify, impacts from El Nino are not expected.
Very extraordinary writing. I
Your Writing
Comments have been disabled on this article