February 2019 ENSO Update: El Niño conditions are here
After several months of flirting, the tropical Pacific ocean and atmosphere appear to have coupled just in time for Valentine’s Day and now meet the criteria for El Niño conditions. Is it true love? Time will tell, but forecasters expect weak El Niño conditions to persist through the spring.
Say yes
For a few months now, the tropical Pacific has met the first two criteria of our “Is It El Niño Conditions?” decision tree.
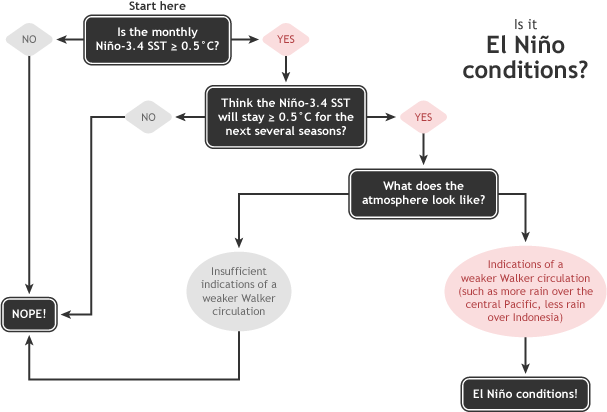
Summary of NOAA decision process in determining El Niño conditions. NOAA Climate.gov drawing by Glen Becker and Fiona Martin.
That is, the sea surface temperature in the Niño3.4 region of the tropical Pacific Ocean has been more than 0.5°C above the long-term average, and models were predicting it would stay that way for the next several seasons.
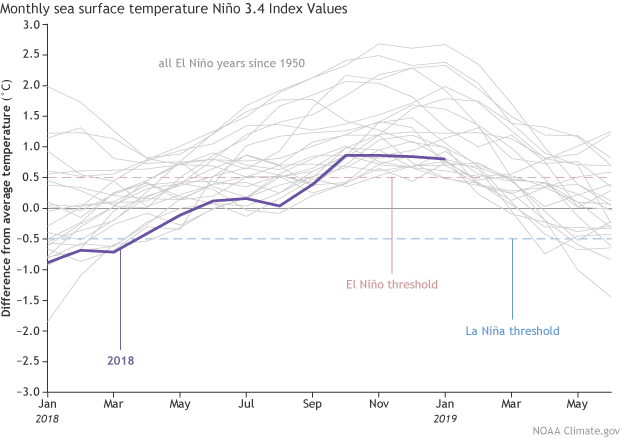
Monthly sea surface temperature in the Niño 3.4 region of the tropical Pacific for 2018 (purple line) and all other El Niño years since 1950. Climate.gov graph based on ERSSTv5 temperature data.
What’s new over the past month is that we’re seeing signs of El Niño-related changes in the atmosphere, with increased clouds and rain in the central Pacific indicating a weaker Walker circulation. One measurement of the strength of the Walker circulation, the Equatorial Southern Oscillation Index, was -0.6 during January, indicating more rising air than average over the eastern Pacific, and less than average over the western Pacific. These changes are enough evidence that the atmosphere is responding to the warmer ocean, leading us to conclude we have El Niño conditions!
Be Mine
The Walker circulation—the atmospheric circulation over the whole tropical Pacific Ocean—is usually driven by intense rising air over the very warm waters of the far western Pacific and Indonesia. This air rises to the upper atmosphere, travels eastward, sinks over the eastern Pacific, and travels back westward near the surface, forming the trade winds.
When El Niño’s warmer-than-average surface waters develop in the central-eastern Pacific, the Walker circulation is weakened. The extra heat in the ocean surface warms the air above it, leading to more rising motion, and hence more clouds and rain than average over the central-eastern tropical Pacific. Adding a source of rising air over the central-eastern Pacific, and reducing the rising air over the far western Pacific, means the steady upper-level and near-surface winds are disrupted. Those weaker-than-average near-surface winds in turn help to keep the surface warmer, in a feedback process critical to the coupled system of El Niño.
Call me
The surface warming in the Niño3.4 region is currently just a few tenths of a degree above the El Niño threshold (0.5°C warmer than average), and actually decreased through January. Most of the climate models predict that the surface temperature anomaly (the difference from the long-term mean) will increase slightly in the near future, and remain above the El Niño threshold through the spring.
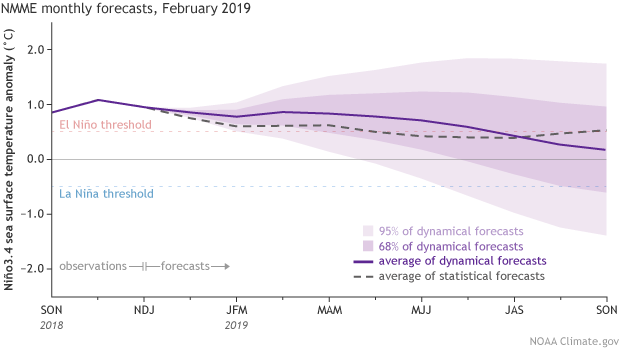
Climate model forecasts for the Niño3.4 Index. Dynamical model data (purple line) from the North American Multi-Model Ensemble (NMME): darker purple envelope shows the range of 68% of all model forecasts; lighter purple shows the range of 95% of all model forecasts. Statistical model data (dashed line) from CPC’s Consolidated SST Forecasts. NOAA Climate.gov image from CPC data.
Bolstering forecasters’ confidence that short-term surface warming will rebound and then persist for the next few months is the presence of warmer-than-average water below the surface of the Pacific. This blob, a downwelling Kelvin wave, will travel eastward over the next few weeks, gradually rising and providing a source of warmer waters to the surface.
Departure from average of the surface and subsurface tropical Pacific sea temperature averaged over 5-day periods starting in early June 2018. The vertical axis is depth below the surface (meters) and the horizontal axis is longitude, from the western to eastern tropical Pacific. This cross-section is right along the equator. Climate.gov figure from CPC data.
U R Cute
But what does it all mean? Is this relationship built to last? The future remains to be seen, but forecasters give weak El Niño conditions the edge through the spring. After that, chances of a continued El Niño drop below 50%. It’s tough to make a successful forecast for later in the year, due in large part to the “spring predictability barrier,” a notoriously tricky obstacle for computer models. Spring is a time of year when ENSO (El Niño/Southern Oscillation, the entire El Niño and La Niña system) is often transitioning, making it especially difficult to predict what comes next.
Weak El Niño conditions means that El Niño isn’t dominating the global circulation, and there is a lower probability of El Niño-related global temperature and precipitation effects through the next few months. Other players, including the Madden-Julian Oscillation, may continue to affect weather patterns. For a prediction of the U.S. climate this spring, check out the Climate Prediction Center’s outlook. For all the ENSO information your heart desires, stick with us!
Comments
El Nino
RE: El Nino
Hi Alex,
The eastern tropical Pacific has been warmer than normal and even above the minimum threshold for El Nino since fall, but the atmospheric conditions have not been consistent with El Nino until more recently (stay tuned for more on this topic in the next blog post!). Regarding your comment about weather being more complicated than El Nino, there is no argument here! As we noted in our Winter Outlook post, we expected other drivers like the Madden-Julian Oscillation and Arctic Oscillation to play important roles in our winter weather this year, both those drivers are much more difficult than ENSO to predict several months in advance.
El Niño
RE: El Niño
By December we had fulfilled all the criteria for El Nino in the decision tree except the very last one - we did not see atmospheric conditions consistent with El Nino, like a clearly weakened Walker circulation or enhanced rainfall near the dateline. At some point between the January and February ENSO Outlooks, the atmospheric conditions became more clearly consistent with El Nino conditions. That is why the El Nino Advisory was not declared until this month.
Pacific blob, long term temp trend
RE: Pacific blob, long term temp trend
Hi Peter,
There's not enough heat from hydrothermal sources to explain sea surface temperature anomalies like the Pacific blob, and it would be difficult to explain the three-dimensional structure of these heat anomalies through hydrothermal sources. Regarding the long-term trend, North Pacific sea surface temperatures, including in the Gulf of Alaska, have been rising over the past 50 years or so, so such warm anomalies are becoming more common. (By the way, this is a nice site where you can do linear trend and other calculations if you have some familiarity with the layout.)
Predictability barrier
Not Consistent With BOM's El Nino Criteria, SOI
RE: Not Consistent With BOM's El Nino Criteria, SOI
Hi Graig,
Just to make sure all readers are clear about this, the NOAA and BOM criteria for an El Nino are not identical (see the BOM criteria here). One of the differences is that BOM has a higher eastern tropical Pacific sea surface temperature threshold, so it is perfectly consistent for NOAA to declare borderline El Nino conditions while BOM does not.
Regarding the SOI, NOAA does not have an explicit criterion like BOM does, but NOAA forecasters certainly consider the SOI and other atmospheric indicators. As mentioned in this and previous blog posts, that was one of the main hold-ups for this event! So to answer your question, there is no specific SOI threshold used by NOAA ENSO forecasters, but forecasters examine the SOI (among other metrics, including central Pacific OLR, Equatorial SOI in different datasets, lower and upper level winds), with a particular focus on how these metrics measure up with respect to their distribution for all previous El Nino events. (The same is true if we have a potential La Nina event.)
We make a final decision based on the preponderance of evidence.
RE: RE: Not Consistent With BOM's El Nino Criteria, SOI
Regular or Modoki El Niño?
RE: Regular or Modoki El Niño?
It is difficult to give a definitive answer to this question because El Nino types do not separate cleanly into canonical or Modoki types. As this post describes, the location of maximum sea surface temperature anomalies varies rather continuously from east to west, so there is no clear separation between the two types. With that said, and also consistent with this post, the weaker El Nino episodes tend to be centered more toward the central Pacific (Modoki-like), and this event is no exception. For researchers who study the differences between canonical and Modoki El Nino, I'm pretty confident nearly all will characterize the current event as a Modoki event. However, keep in mind that there are different methods for distinguishing ENSO "flavors," so we cannot expect universal agreement for all cases.
El Nino effects on Southern Africa
i love all of your passages
CFSv2
RE: CFSv2
Hard to say what the CFS is currently grabbing onto. It is important though to remember that forecasts made through the spring are notoriously challenging, so I wouldn't pay much attention to the longer lead forecasts at this time.
Is another huge El Nino on the way?
RE: Is another huge El Nino on the way?
That is certainly something we will be monitoring throughout the spring, summer and fall. It's hard to say what next winter may hold this far in advance. In Emily's latest post on the March ENSO forecast, she touches on some of the similarities between this year and 2015.
Any relief in sight for the northeast U.S.
RE: Any relief in sight for the northeast U.S.
I feel your frustration, as I write this on a cool and soggy Sunday in New Jersey. I am not sure when the relief will come. The CPC seasonal outlooks do not indicate a strong signal for precipitation in the northeast US, so they generally call for equal chances of above or below precipitation in the coming months. We'll definitely continue to monitor any changes.
ENSO what is surface current?
RE: ENSO what is surface current?
This is a good question. I will look around to see if I can find one.
El neno patterns
major hurricane
RE: major hurricane
Making forecasts for where hurricanes may hit during a season is too difficult. However, the Climate Prediction Center did recently issue their updated forecast for the rest of the Atlantic hurricane season. Read all about it here.
Pacific coast superb spring rains and hotter summer months in 10
RE: Pacific coast spring rains and hotter summer months in 10
Conditions across the Pacific returned to normal in July 2019. At this time, ENSO-neutral conditions are most likely to continue through Spring 2020.
Comments have been disabled on this article