March 2017 ENSO update: on the fence
With La Niña in the rear-view mirror, forecasters expect that neutral conditions will continue through the spring. After that, there are increasing chances of El Niño making an appearance, but they’re still not very strong chances—around 50% by the late summer, but not quite at the point to warrant an El Niño Watch. What’s behind this verdict?
Pre-trial briefing
First, a quick review of the recent facts. Sea surface temperatures in the Niño3.4 region (our main region for monitoring and predicting ENSO) were close to average during February, measuring -0.15°C below average in the ERSSTv4 dataset, and +0.14°C above average in the OISST dataset. These two datasets have different input and spatial detail, so they’re usually not in perfect agreement, but they are both telling us the same thing: surface temperatures are more or less normal. (Check out Tom’s post for more on how they can disagree and still be reliable.)
Clouds and rain were still somewhat less than average in February over the central Pacific, and greater than average over the Maritime Continent (the group of islands north of Australia and south of China), in a La Niña-like pattern. Overall, though, both the atmosphere and the ocean are reflecting neutral conditions, with no substantial departures from average.
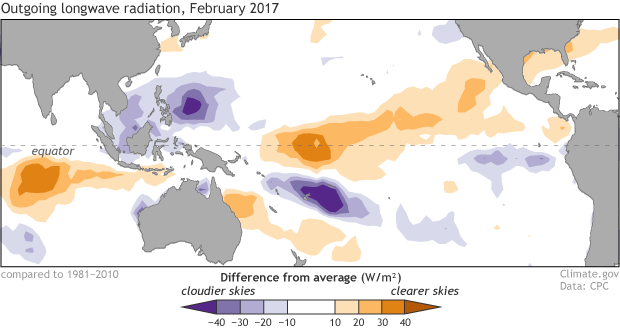
Places that were more (purple) or less (orange) cloudy than the 1981-2010 average during February 2017, based on satellite observations of outgoing longwave radiation (heat). Thick clouds block heat from radiating out to space, so less radiation = more clouds, and more radiation = clearer skies. Climate.gov map from CPC data.
Witness for the prosecution
ENSO (El Niño Southern Oscillation) forecasters rely on dynamical models—computer models that start from the observed conditions and use physics and mathematics to predict future conditions. To make a forecast for a single target (e.g. a forecast made in March for July’s sea surface temperature), contemporary models are run many times, starting with slightly different observed conditions in each run. Using a range of starting conditions and then running the model forward generates a range of possible outcomes.
The average of all these forecasts is considered the most predictable part of the forecast, but the range itself also provides valuable information. A small range tells forecasters that the models are fairly confident; a wide range means that the models don’t have much agreement on what the future will look like.
The North American Multi-Model Ensemble (NMME) is a set of several state-of-the-art dynamical models, with over 100 different possible outcomes total. The NMME forecast for Niño3.4-region sea surface temperature is a key contributor to ENSO prediction.
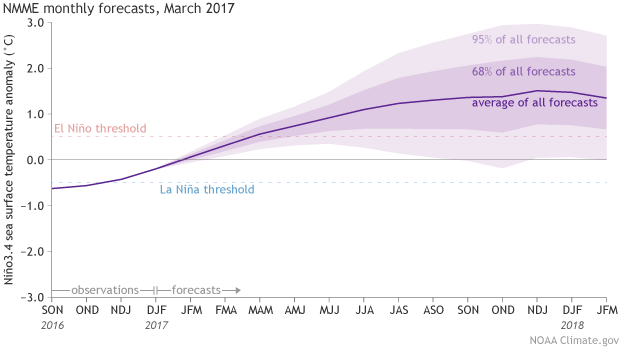
Climate model forecasts for the Niño3.4 Index, from the North American Multi-Model Ensemble (NMME). Darker purple envelope shows the range of 68% of all model forecasts; lighter purple shows the range of 95% of all model forecasts. NOAA Climate.gov image from CPC data.
As you can see, the average (the dashed line) is predicting the development of El Niño sometime later this year, and over two-thirds of forecasts are for a Niño3.4 sea surface temperature more than 0.5°C above normal—the El Niño threshold.
Witness for the defense
What the graph also shows, however, is that despite the average being in El Niño territory, a wide range of outcomes are possible—in fact more than what is even shown in the graph (if we had more computing power and more models we could see an even wider range). Getting such spread from models whose starting conditions were only slightly different from one another suggests we shouldn’t be too confident in any outcome yet.
And we can’t forget about the spring predictability barrier—the lower skill of model forecasts made in the early spring. While modern dynamical models have better skill through the spring than older models, we still exercise caution based on our analysis of past model data.
Other than the model forecasts, there isn’t a whole lot of evidence right now that suggests we can more confidently expect El Niño to develop later this year. As Aaron covered in his post last month, one of the factors we look at is the “warm water volume,” the amount of warmer water below the surface of the tropical Pacific. To vastly simplify his point (really, you should check out his great post), more warm water than average during the spring is sometimes, but not always, followed by El Niño. On the other hand, less warm water than average rarely precedes El Niño.
I checked in with our resident oceanographer at CPC, Yan Xue. She reports that although warm water volume has been trending upward over the past several months, the value averaged over January and February 2017 was slightly below average.
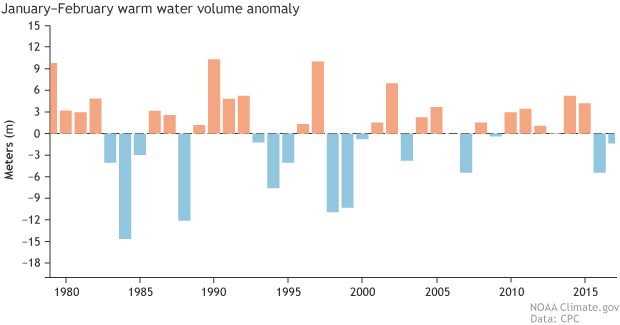
The depth of warm water (at least 20°C, or 68°F) under the surface of the tropical Pacific ocean during January–February each year compared to the 1981-2010 average. The warm water layer was deeper this winter than last (blue bar is shorter), but it remains shallower than average. Negative anomalies of warm water volume rarely foreshadow El Niño. Graph by climate.gov from CPC data.
Yan also pointed out how warm the rest of the Pacific is, and said that we don’t fully understand how such a warm surrounding ocean could affect the development of El Niño.
As a final rebuttal witness, it’s historically very rare to switch back and forth between El Niño, La Niña, and El Niño three winters in a row. We have only one example in our (admittedly short) record, over the period of 1963-1966. Of course, the prosecution would argue this just proves it’s possible!
Closing statements
If you’re an El Niño zealot, you may have noticed that the Australian Bureau of Meteorology has raised an “El Niño Watch,” meaning they have determined a 50% likelihood that El Niño will develop in 2017. Their system is different from ours—for example, it has three categories of alerts as opposed to our two, and a 50% chance triggers their “Watch” criteria.
We require some more supporting evidence, and so our alert system remains quiet for now. In other words, after careful deliberations, our jury found in favor of the fence.
Comments
Past spring SST spreads compared to current
Yes, this idea of measuring
Yes, this idea of measuring the spread of the ensemble members for the current forecast to the spread found in other years, for the same starting season and target period, is a reasonable way to assess the uncertainty this year compared to that of other years. And it has been used in operational situations at forecast producing centers. Your comment about the statistical robustness of the ensemble spread as a key to the true uncertainty is also right on the mark -- the spread is technically a standard deviation (or variance), and it requires a larger sample for those statistics to "settle down" than it does for the mean. Besides the ensemble spread (or, what you have called RMOP), another way to assess the uncertainty is to look at the quality of forecasts in the past for the same starting month and the same target period. If the correlation coefficient is used to measure the past forecast quality (correlation between the forecasts and the corresponding obserations), then the standard error can be computed from that correlation [technically, it is the square root the quantity (1 - correlation-squared) ] and that standard error gives us the +/- 68% and +/- 95% uncertainty ranges. This latter method gives the same uncertainty for any year, whereas the ensemble spread, or RMOP, gives it differently for each year, which is more useful if it is trustworthy (which it probably is, at least to some extent).
Science
RE: Science
Yes, that's right. The question is whether the RMOP method, indicating the amount of ensemble member variability, really indicates the uncertainty, or is largely a measure of sampling variability or even the unique characteristics of the models. The sampling variability issue could be solved by having a very large number of ensemble members (like >100 or even >200). The second factor is very hard to guage.
Science
RE: Science
Many of us would like to think that the models can look at the evidence more effectively than we can. They crunch the equations, using the starting data -- the same data you or I would examine by eye, plus other data that we might ignore or not have time to look at. I think Aaron's post said that El Nino development requires not just above-average warm water volume (WWV), but also some westerly wind events during the key times of the year, to set things in motion and keep the event going strong. And those westerly wind events are very hard to predict. So how would a "good" dynamical model know if these wind events will occur or not? Most of the model anomalous westerly winds are responses to SST increases near and east of the dateline. But how do we get the increases without the winds? It's the vicious cycle we call coupling. The random winds can play a large role in getting that coupling started. Some of the models may incorporate the westerly wind events using statistical abbreviations, which assume an average amount of them. This would be similar to how they estimate convective cells (thunderstorms) too small to be modeled directly, since most of them occur in between the model's grid points.
When you say that there isn't a whole lot of evidence other than the model forecasts, it sounds like you're working from an implicit assumption that the models are not necessarily trustworthy, and that we would like to be able to note some obvious signs ourselves in the absence of the model forecasts. Notice that I am not saying I disagree with you! But with this many dynamical models agreeing on a good likelihood of El Nino, it becomes hard to ignore them. On the other hand, around half of the statistical models are not calling for El Nino. Statistical models are more "transparent" than dynamical ones in that the relationships between their predictors and the ENSO-related SST are often understood and trusted by the people who develop those models. And the relationships are usually linear, which makes them simpler. We know from our studies that when faced with the spring ENSO predictability barrier (like right now), many dynamical models tend to be too bullish in their forecasts -- i.e., too confident and strong. It's possible many of the dynamical models calling for El Nino are coming on too strong. Even if we reduce their anomalies by, say, 40%, we still have many of them predicting at least a weak El Nino.
I and other ENSO forecasters have the same questions and doubts that you do. The only possible difference is that we may give the models a little more weight than you do, even if we can't follow their "reasoning" as easily as we can note obvious signs, like WWV, current anomalous low-level winds, etc. So I think your doubts are healthy ones. The way we deal with our doubts is that we assign lower probabilities to an El Nino event coming this summer/fall than the models do if taken literally. Our probabilities are just barely over 50%, while the models imply a greater probablity.
Current (March 20) warm pool west of Peru?
RE: Current (March 20) warm pool west of Peru?
At this point, the flooding in Peru is largely related to the anomalously warm coastal SSTs occurring close to the typical peak in actual SSTs in that region. We've seen no westerly wind bursts (have actually had a prolonged period of enhanced easterlies in the central and west central Pacific), with the warming in the eastern Pacific related to westerly surface anomalies in that region.
Comments have been disabled on this article