Did global warming stop in 1998?
No, but thanks to natural variability, volcanic eruptions, and relatively low solar activity, the rate of average global surface warming from 1998-2012 was slower than it had been for two to three decades leading up to it.
How much slower depends on the fine print: which global temperature dataset you look at, whether it includes the Arctic, and the exact time periods you compare. Regardless, the big picture of long-term global warming remained unchanged.
(top) Based on NOAA data, global average surface temperature (orange line) has risen 0.13°F (0.07°C) per decade since 1880 (red line), which is nearly identical to the rate of warming during the 15-year period from 1998-2012 (gray line). (bottom) The rate of warming from 1998-2012 was slower than the two preceding 15-year periods, but faster than the two 15-year periods before that. NOAA Climate.gov graph, based on data from NCEI.
Those who deny the scientific evidence of human-caused global warming turned the slowdown into a slogan: “Global warming stopped in 1998.” In scientific journals and assessment reports, climate experts described the episode as a “pause” or “hiatus” in the previous decades’ rapid warming: they knew it wouldn’t last.
Not only was 1998-2012 the warmest 15-year period on record at the time, but greenhouse gases continued to climb to new record highs, and other climate indicators continued to show the impacts of long-term, global-scale warming: subsurface ocean heating, global sea level rise, the melting of glaciers and ice sheets, and record-low Arctic sea ice extent.
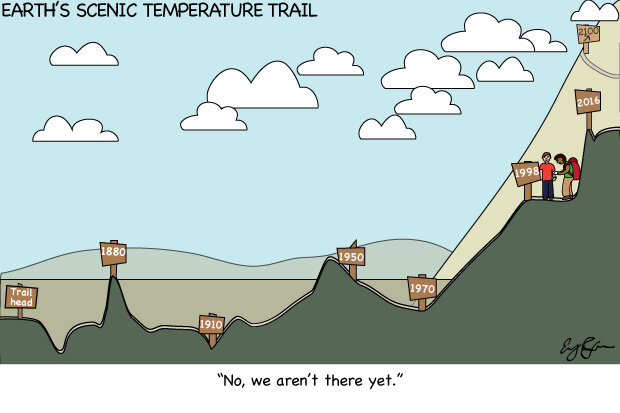
Like a hiking trail over hilly terrain, the global surface temperature can rise steeply, level out, or even fall for short “distances.” Overall, though, it’s a climb from the trailhead to the summit. NOAA Climate.gov cartoon by Emily Greenhalgh.
Like previous episodes in the historical record, the slowdown in the rate of surface warming during the early twenty-first century was temporary. Global average surface temperatures set a new record in 2014, again in 2015, and again in 2016. The rate of surface warming since the late 1980s has been more than twice as fast as the warming averaged over the entire historical record.
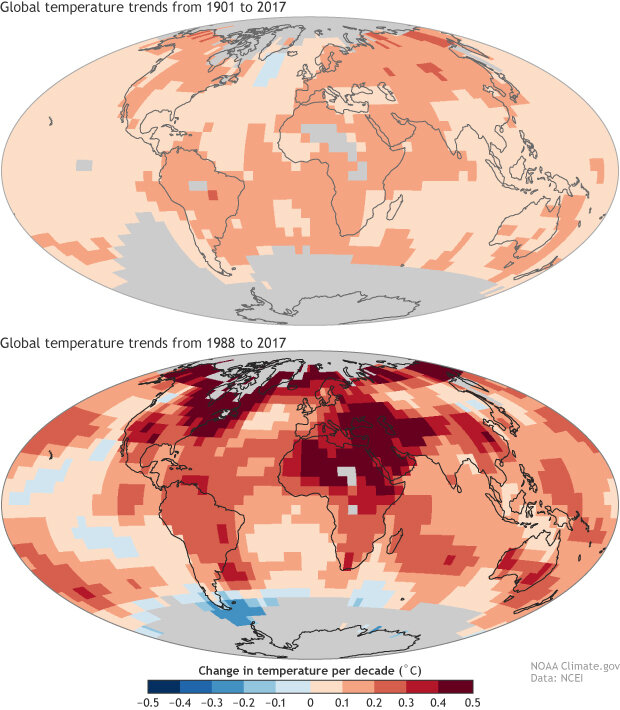
Trends in global surface temperature by decade for 1880–2017 (top map) compared to trends for 1988–2017 (bottom map), showing the rapid warming of the past 30 years. Maps by NOAA Climate.gov, based on data from NOAA NCEI.
The relative slowdown in surface warming from 1998-2012 compared to the preceding decades was just the latest example of the short-term cooling influences overlapping with the long-term global warming trend.
Cooling influence #1: Natural variability in the Pacific Ocean
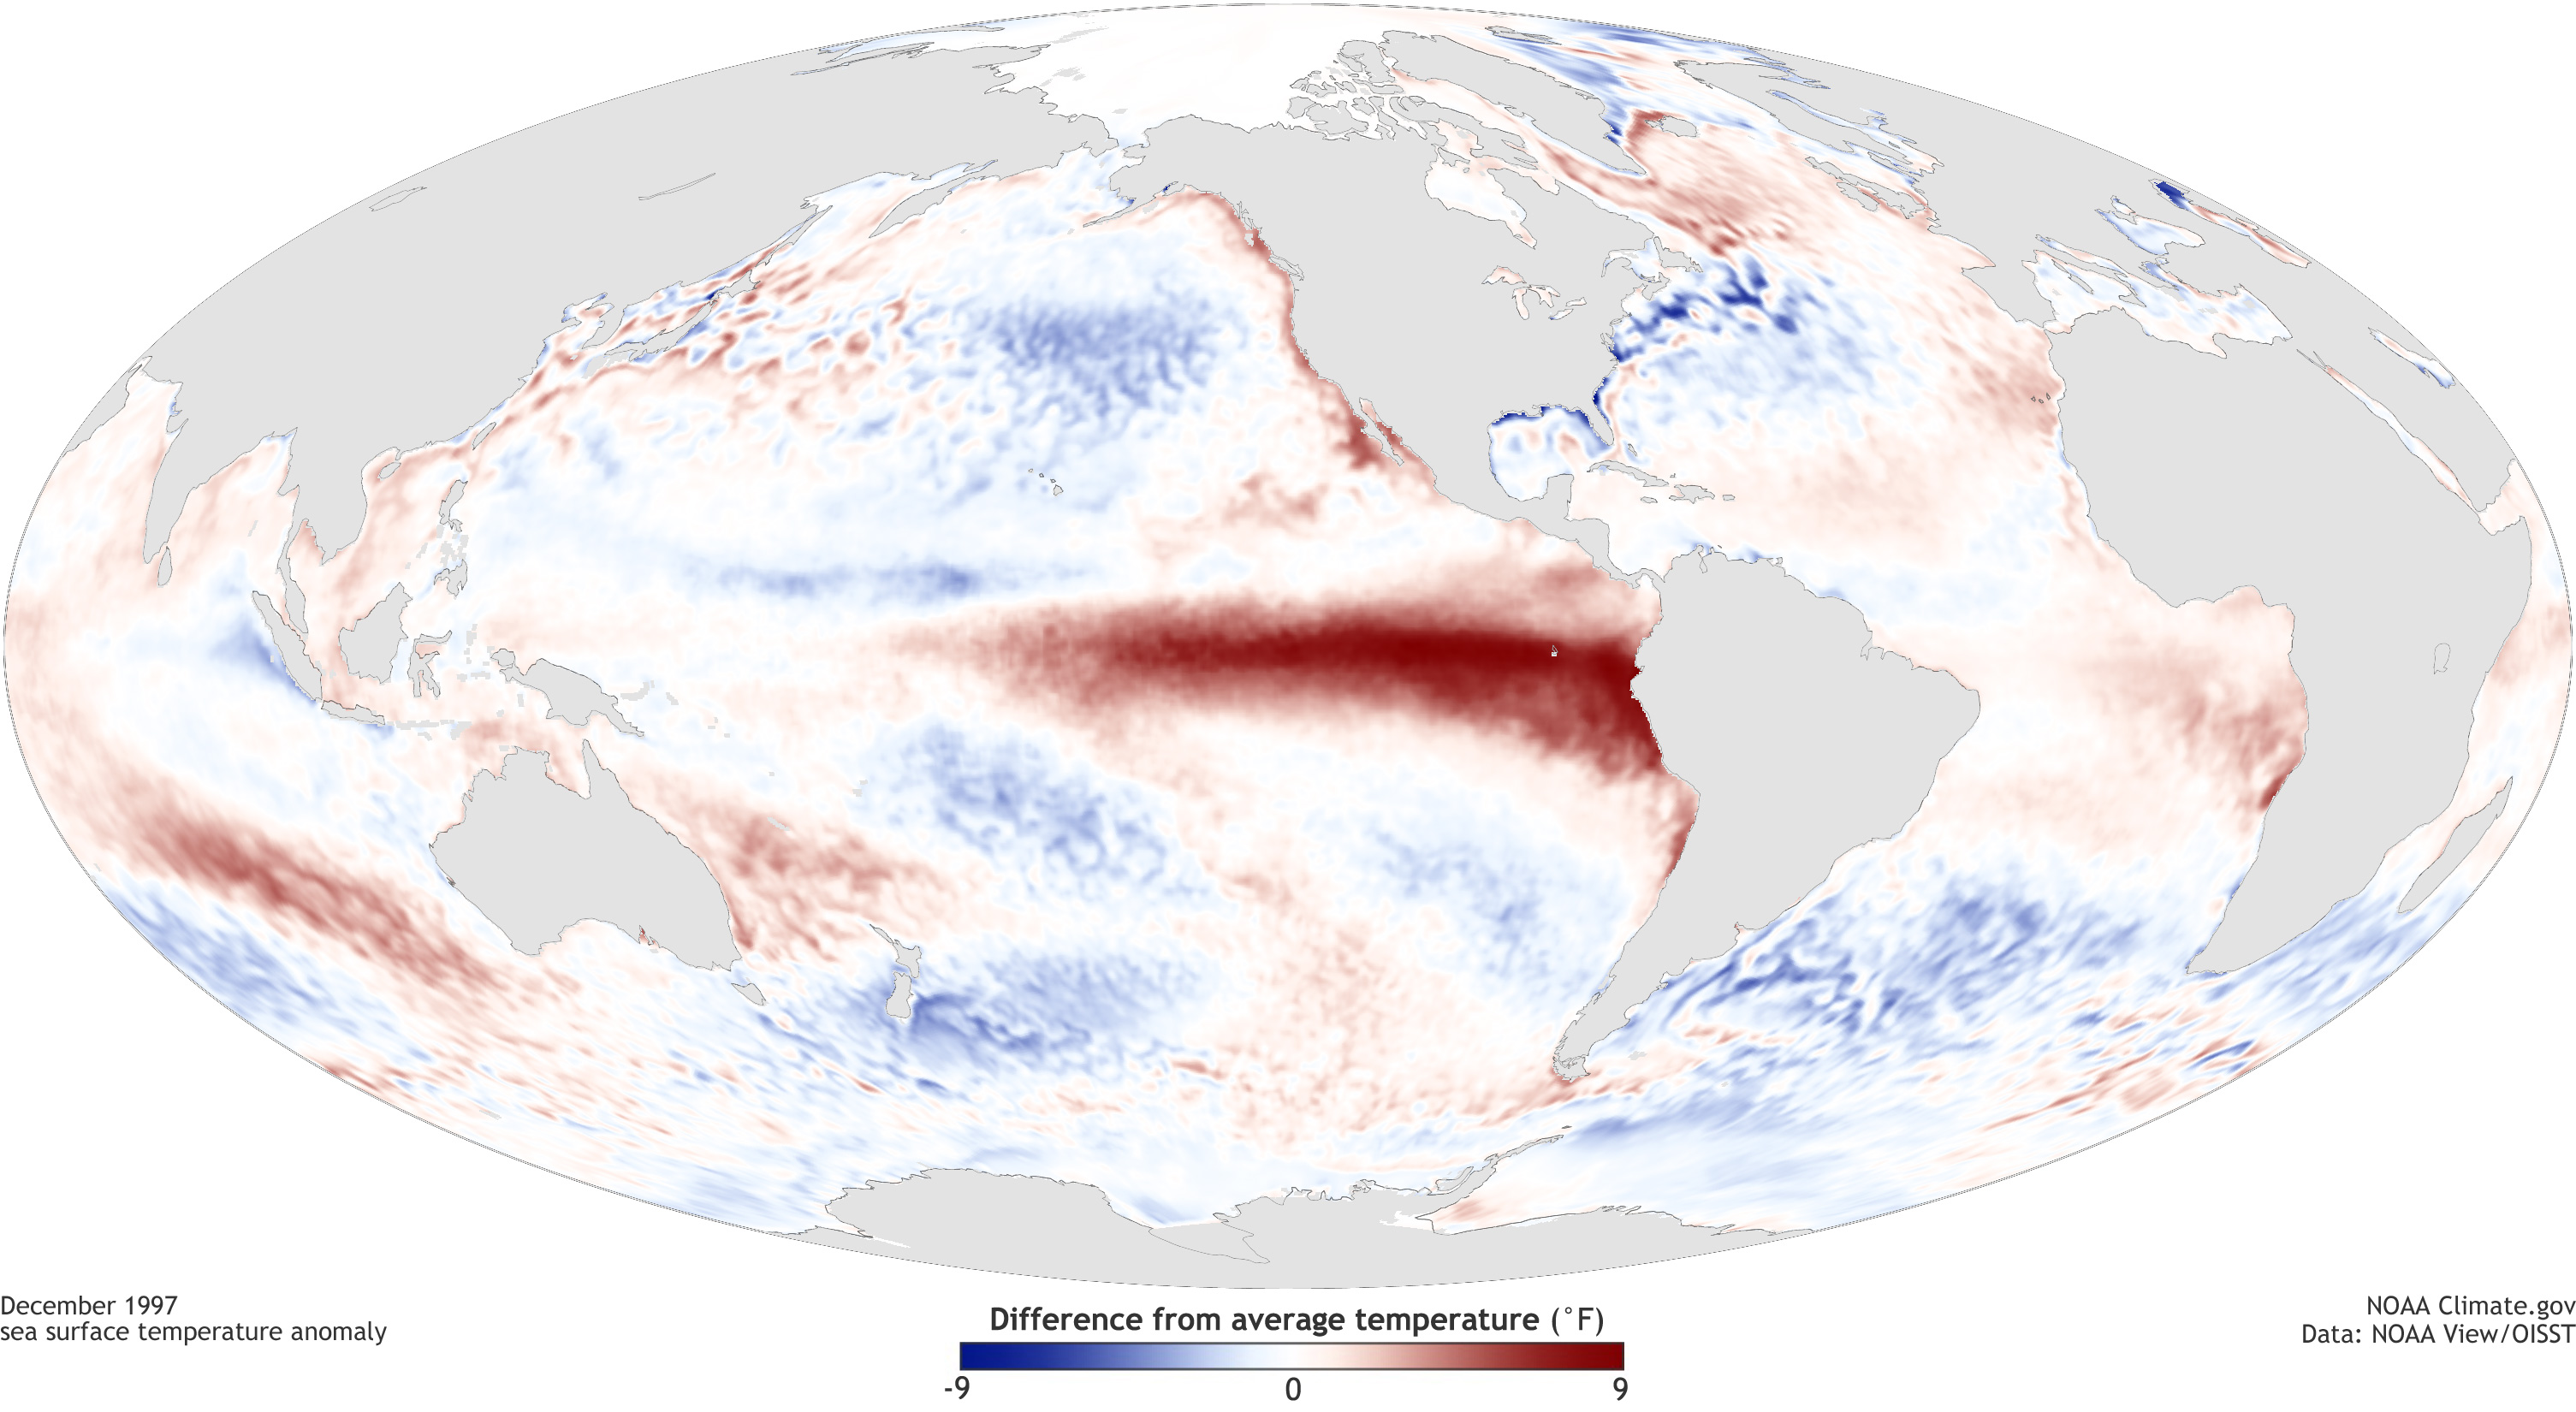
The slowdown in surface warming from 1998–2012 relative to previous decades started with one of the strongest El Niño events on record. El Niño is the warm phase of a powerful natural climate oscillation in the tropical Pacific Ocean. El Niño emerges irregularly every few years, taking turns with La Niña, its cool-phase partner.
The pattern is anchored in the tropics, but it has a global impact. In any given decade, the warmest years are usually El Niño years; the coldest are usually La Niña ones. [See How does ENSO affect global temperature? in our El Niña/La Niña FAQ.]
The 1997-98 El Niño contributed to the largest (at the time) one-year jump in global average surface temperature on record, helping to make 1998 the warmest year of the twentieth century. Choosing a record-warm year as the starting point for a trend analysis increases the odds of finding a cooling trend. The influence of that record-warm El Niño year on short-term temperature trends was amplified by a heavy tilt toward La Niña events over the next 15 years.
Following the strong 1997-98 El Niño, La Niña events (blue shading) outnumbered El Niño events (red shading) over the next 15 years, contributing to the 1998-2012 surface warming slowdown. Graph by NOAA Climate.gov, based on data from NOAA’s Climate Prediction Center.
Often, El Niño and La Niña events are embedded within the warm and cool phases of an even larger-scale climate pattern: the Pacific Decadal Oscillation (“PDO” for short). The PDO influences surface temperature across the entire Pacific north of the equator. As its name implies, the PDO tends to favor its warm or cool phases for a decade or more at a time. Around 2000, the cool phase became more common.
During the cool phases of the PDO, prevailing winds drive strong ocean circulations that push heated surface water deeper into the ocean and draw cooler water up to the surface. Heat doesn’t disappear; it just doesn’t all show up at the surface. During the early twenty-first century, observations of the water column down to depths of 2,000 meters (6,600 feet) showed excess heat continued to accumulate in the ocean.
Water has tremendous heat capacity. Natural variations in winds and currents can shift heat from the surface to deeper parts of the ocean. Observations of the amount of heat energy stored in the top 2,000 meters (6,600 feet) of the ocean show that ocean heating continued during the surface warming slowdown. NOAA Climate.gov, adapted from Figure 1 in Cheng et al., 2017.
Cooling influence #2: Not your average solar cycle
The Sun has an 11-year geomagnetic cycle. From the peak to the minimum, the average amount of energy reaching the top of Earth’s atmosphere varies by about 0.1%. It’s a small difference: in an average cycle, it’s only enough to warm or cool Earth’s surface temperature by approximately 0.05 degrees Celsius. (There also appears to have been a small, long-term increase in solar activity in the early twentieth century, which added to the human-caused global warming trend during that period).
The solar cycles that coincided with the 1998-2012 surface warming slowdown were below average. Solar cycle 23 had an unusually long and low minimum, and solar cycle 24 had the lowest maximum in more than a century. The relatively weak solar activity made a small contribution to slowing surface warming in the early part of the new century.
The peaks and valleys in solar geomagnetic activity since 1900, based on the number of sunspots observed on the face of the Sun each day (orange dots). The minimum of solar cycle 23 was unusually drawn out, and the maximum of the next cycle was among the lowest of the past century. Graph by NOAA Climate.gov, based on data from the WDC-SILSO, Royal Observatory of Belgium.
Cooling influence #3: Sunlight-reflecting volcanic particles
Along with ash and other debris, volcanic eruptions include sulfur dioxide gas. Sulfur dioxide reacts with water vapor to produce sulfate particles. These aerosol particles act like billions of tiny mirrors, reflecting a fraction of incoming sunlight.
Most eruptions aren’t powerful enough to influence the climate on a global scale. But an eruption that is powerful enough to reach the stratosphere—especially in the tropics, where the particles spread easily to both hemispheres—can cool the climate for several years.
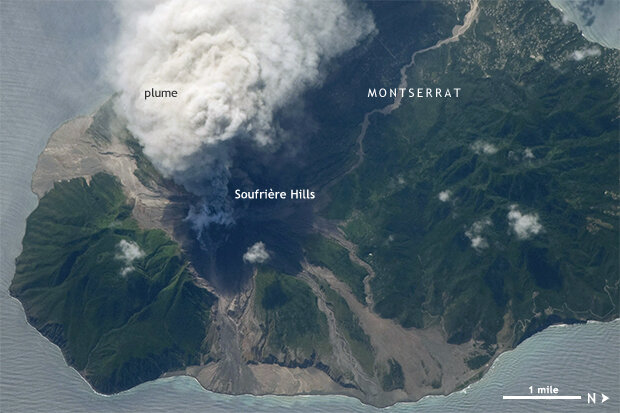
Soufriere Hills Volcano on the Caribbean island of Montserrat erupted repeatedly in the first decade of the twenty-first century, most notably in 2002, 2006, and 2009. On October 11, 2009, an astronaut on the International Space Station captured this image of a volcanic plume of ash and gases towering over the southwestern corner of the island. Image courtesy NASA-JSC Gateway to Astronaut Photography of the Earth.
Normally, when we talk about climate-scale eruptions, we are talking about cataclysmic events like the 1991 eruption of Mount Pinatubo in the Philippines. While we haven’t seen any single eruptions like that in recent years, a number of moderate eruptions took place in the tropics between 2000-2010.
Together, these eruptions—especially the 2006 eruptions of Montserrat’s Soufriere Hills Volcano and Papua New Guinea’s Tavurvur Volcano—gradually boosted the amount of light-reflecting particles in the stratosphere during the warming slowdown period.
Stratospheric haze peaked following the cataclysmic eruption of Mount Pinatubo in 1991, was low throughout the mid- to late 1990s, and gradually built back up in the first decade of the 2000s due to moderate but frequent eruptions of tropical volcanoes. Graph by NOAA Climate.gov, based on SAGE, GOMOS, and CALIPSO data provided by Jean-Paul Vernier.
Combined cooling: Model confirmation
In order to verify the combined impact of these cooling influences on surface temperatures, experts have turned to virtual worlds simulated by computer-driven mathematical climate models.
Experiments have demonstrated that both Pacific Ocean variability and random atmospheric variations are each capable of generating a surface warming slowdown that matches the 1998-2012 period, not just in amount, but also in its geographic details. When models also include observed patterns of volcanic aerosols and low solar activity, temperatures projections match observations even more closely.
CMIP5 model simulations of global surface temperature (orange and red lines) compared to observations (dark gray line with shading around the range of uncertainty): (top) without any cooling influences, (middle) with adjustment for observed solar and volcanic activity, (bottom) with adjustments for solar and volcanic activity plus natural warm/cool variability in the Pacific Ocean. Graphs by NOAA Climate.gov, adapted from Figure 5 in Medhaung, et al., 2017.
The surface warming slowdown between 1998 and 2012 turned into a great opportunity for climate experts to take a fresh look at the influence of all the players in the climate game, to scrutinize observational records, and to test models. But it wasn’t a chance to escape the reality that rising concentrations of carbon dioxide and other greenhouse gases continue to warm Earth’s climate over the long term.
References
Balmaseda, M. A., K. E. Trenberth and E. Källén (2013), Distinctive climate signals in reanalysis of global ocean heat content. Geophys. Res. Lett., 40, Doi: 10.1002/grl.50382.
Brühl, C., Lelieveld, J., Tost, H., Höpfner, M. & Glatthor, N. Stratospheric sulfur and its implications for radiative forcing simulated by the chemistry climate model EMAC. J. Geophys. Res. Atmos. 120, 2103–2118 (2015).
Cheng, L., K. Trenberth, J. Fasullo, T. Boyer, J. Abraham, and J. Zhu, 2017: Improved estimates of ocean heat content from 1960-2015. Sci. Adv. 3, 3, e1601545, Doi:10.1126/sciadv.1601545. http://advances.sciencemag.org/content/3/3/e1601545
Cheng, L., K. E. Trenberth, J. Fasullo, J. Abraham, T. Boyer, K. von Schuckmann, J. Zhu, 2018: Taking the pulse of the planet. Earth and Space Science News, Eos, 99, 14-16. Doi: 10.1029/2017EO081839.
Cowtan, K., Z. Hausfather, E. Hawkins, P. Jacobs, M. E. Mann, S. K. Miller, B. A. Steinman, M. B. Stolpe, and R. G. Way (2015), Robust comparison of climate models with observations using blended land air and ocean sea surface temperatures, Geophysical Research Letters, 42, 6526–6534, doi:10.1002/2015GL064888.
Deser, C., R. Guo, and F. Lehner (2017), The relative contributions of tropical Pacific sea surface temperatures and atmospheric internal variability to the recent global warming hiatus, Geophys. Res. Lett., 44, 7945–7954, doi:10.1002/2017GL074273.
Hawkins, E. (2015). An apples to apples comparison of global temperatures. Climate Lab Book blog.
Held, I.M. (2013), Climate science: The cause of the pause. Nature 501, 318-319.
IPCC, 2013: Summary for Policymakers. In: Climate Change 2013: The Physical Science Basis. Contribution of Working Group I to the Fifth Assessment Report of the Intergovernmental Panel on Climate Change [Stocker, T.F., D. Qin, G.-K. Plattner, M. Tignor, S.K. Allen, J. Boschung, A. Nauels, Y. Xia, V. Bex and P.M. Midgley (eds.)]. Cambridge University Press, Cambridge, United Kingdom and New York, NY, USA.
Karl, T. R., Arguez, A., Huang, B., Lawrimore, J. H., McMahon, J. R., Menne, M. J., … Zhang, H.-M. (2015). Possible artifacts of data biases in the recent global surface warming hiatus. Science, 348(6242), 1469–1472. https://doi.org/10.1126/science.aaa5632
Kosaka Y., and S-P. Xie (2013) Recent global-warming hiatus tied to equatorial Pacific surface cooling. Nature, 501, 403-407, doi: 10.1038/nature12534
Medhaug, I., Stolpe, M. B., Fischer, E. M., & Knutti, R. (2017). Reconciling controversies about the “global warming hiatus.” Nature, 545(7652), 41–47. https://doi.org/10.1038/nature22315
NOAA National Centers for Environmental Information, State of the Climate: Global Climate Report for Annual 2017, published online January 2018, retrieved on August 29, 2018 from https://www.ncdc.noaa.gov/sotc/global/201713.
Program for Climate Model Diagnosis & Intercomparison. CMIP5, Coupled Model Intercomparison Project Phase 5: Overview. [online] https://pcmdi.llnl.gov/mips/cmip5/ Accessed February 13, 2018.
Trenberth, K. E., and J. T. Fasullo (2010), Tracking Earth's energy. Science, 328, 316-317.
Trenberth, K. E. and Fasullo, J. T. (2013), An apparent hiatus in global warming?. Earth's Future, 1: 19–32. doi:10.1002/2013EF000165
Wuebbles, D.J., D.R. Easterling, K. Hayhoe, T. Knutson, R.E. Kopp, J.P. Kossin, K.E. Kunkel, A.N. LeGrande, C. Mears, W.V. Sweet, P.C. Taylor, R.S. Vose, and M.F. Wehner, 2017: Our globally changing climate. In: Climate Science Special Report: Fourth National Climate Assessment, Volume I [Wuebbles, D.J., D.W. Fahey, K.A. Hibbard, D.J. Dokken, B.C. Stewart, and T.K. Maycock (eds.)]. U.S. Global Change Research Program, Washington, DC, USA, pp. 35-72, doi: 10.7930/J08S4N35.
Vernier, J.-P., Thomason, L. W., Pommereau, J.-P., Bourassa, A., Pelon, J., Garnier, A., … Vargas, F. (2011). Major influence of tropical volcanic eruptions on the stratospheric aerosol layer during the last decade. Geophysical Research Letters, 38(12), L12807. https://doi.org/10.1029/2011GL047563