Going out for ice cream: a first date with the Pacific Decadal Oscillation
We talk a lot about El Niño and La Niña at the ENSO blog, but there are other phenomena that garner interest among scientists, even if they do not have the same brand recognition as El Niño. So while we wait for a potential La Niña (forecaster checks watch), this blog post will take us on a first date with a sea surface temperature (SST) pattern in the North Pacific Ocean called the Pacific Decadal Oscillation or the PDO. (Tony already provided our meet cute with the PDO.)
First identified in the late 1990s (Mantua 1997), the PDO is the most significant year-round pattern in monthly SSTs across the North Pacific. Similar to ENSO, the PDO has two states – warm and cold – and involves various other aspects of the climate system. Unlike ENSO, the PDO isn’t one climate phenomenon. What we call the PDO is instead an aggregation of mostly independent processes. If ENSO is an ice cream flavor, the PDO is climate Neapolitan -- a combo of different individual processes which influence a broader area.
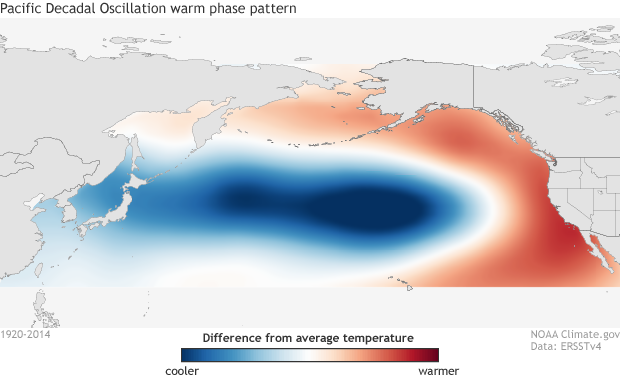
Sea surface temperature (SST) anomaly pattern associated with the positive (or warm) phase of the Pacific Decadal Oscillation (PDO). Red shading indicates where SSTs are above average, and blue shading shows where SSTs are below average. During negative (cold) phases, the pattern reverses. Image adapted by NOAA Climate.gov from original by Matt Newman based on NOAA ERSSTv4 data.
What does the PDO look like?
The warm phase of the PDO consists of a boomerang of warmer-than-average seas along the coast of western North America with a pocket of colder-than-average waters in the central North Pacific. The cool phase is the opposite. If we compute an index to attempt to quantify the strength of the PDO we would find that there are distinct periods of time, “regimes,” where the PDO is more consistently negative or positive.
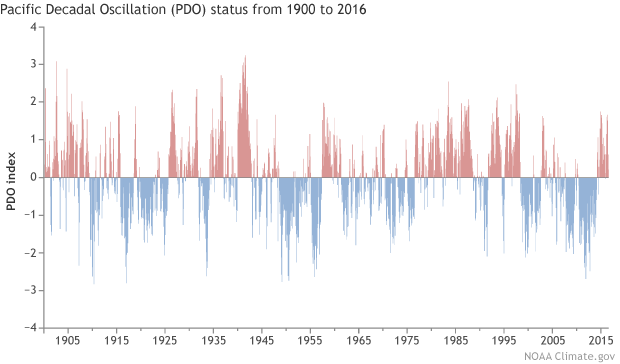
Pacific Decadal Oscillation (PDO) index values from 1900 to 2016. The PDO temperature pattern seems to follow multi-year regimes, in which the index is mostly positive (warm) or negative (cool). Image by NOAA Climate.gov, based on original provided by Matt Newman.
What makes up the PDO Neapolitan sundae?
The Aleutian Low
To keep this simple (and for the analogy to still work), it’s easiest to think of three things that make up the PDO. The first—our chocolate—involves the strength of a semi-permanent area of low atmospheric pressure off the Aleutian Islands, creatively called the Aleutian Low.
In the Northern Hemisphere, air circling a low spins counterclockwise: from the north on the western side of the low, and from south on the eastern side. The stronger the low, the stronger the winds.
If the Aleutian low is stronger-than-average, unusually strong southerly winds on the eastern side of the low run along the west coast of North America, warming the coastal waters by reducing the amount of cold water that normally comes up from depth. On the western side of a strong Aleutian low, the northerly winds and the stormy conditions help to rile up the water increasing the amount of cold water at the surface, and leading to below-normal sea surface temperature anomalies. The opposite is true for a weaker-than-average or non-existent Aleutian low.
So what makes the strength of the low vary? A couple major things: 1) Random weather that we simply cannot predict months or years in advance. 2) ENSO! El Niño, for instance, generally leads to a stronger-than-average Aleutian low during winter when the low is usually already at its strongest. La Niña leads to a weaker Aleutian low. Thus, one major influence on the PDO is the state of ENSO!
The persistence of (ocean) memory
The vanilla in the PDO’s climate Neapolitan is the ocean itself. SST anomalies that develop due to random weather or an El Niño/La Niña normally wind up reaching below the sea surface. These deeper anomalies can get stuck at depth—cut off from weather patterns and currents at the surface that cause anomalies to dissipate—only to “re-emerge” the following year.
The getting stuck happens in the summer (1). Sort of like how your favorite long sleeve shirt might make its way to the bottom of the drawer and be forgotten during the warm summer months only to re-emerge the following winter. This phenomenon is called “reemergence,” and it helps to continue trends in the PDO from year to year (Alexander and Deser 1995).
The Kuroshio Current
Lastly, our final flavor—the strawberry in this Neapolitan—is the Gulf Stream of the North Pacific Ocean, the Kuroshio Current. Changes along the ocean current in terms of strength and location, which occur over decadal time periods, can also impact SSTs in the western half of the North Pacific (2). Put all three of those impacts on the ocean together and you get most of the PDO.
So what does the PDO actually do then?
If you noticed, the three items mentioned above don’t necessarily act together or really have anything to do with each other. That’s because the PDO is not a well-oiled machine like ENSO; it’s the ocean surface temperature’s aggregated response to all sorts of atmospheric and oceanic processes. For the most part, the atmosphere is what changes the temperature pattern across the North Pacific Ocean, not the other way around. The PDO is therefore a response, not an agent of change itself.
But what about those regimes—time periods of consistently positive or negative PDOs? If the processes aren’t really connected, how do those periods arise? Well, it could be a natural result of the efforts to try and capture all of the influences in the variability of the Aleutian Low, which manifests itself in ocean temperatures in the North Pacific, via one index, the PDO.
Each “regime” of the PDO could be due to a random assortment of processes ranging from ENSO to ocean reemergence to random weather. In fact, it is known that ENSO can have periods where El Niños occur more often than La Niñas (Wittenberg et al., 2014). Since ENSO has such an influence on the PDO, these PDO regimes could be reflecting ENSO regimes.
Can the state of the PDO predict anything about the atmosphere though?
Since the PDO largely represents an ocean response to the atmosphere, you have to be careful in saying that the PDO actually causes any big change in the atmospheric circulation. It can have an influence locally, though. If you live adjacent to the west coast, a positive PDO can lead to local impacts to weather and climate through the direct effects of warmer-than-average ocean waters.
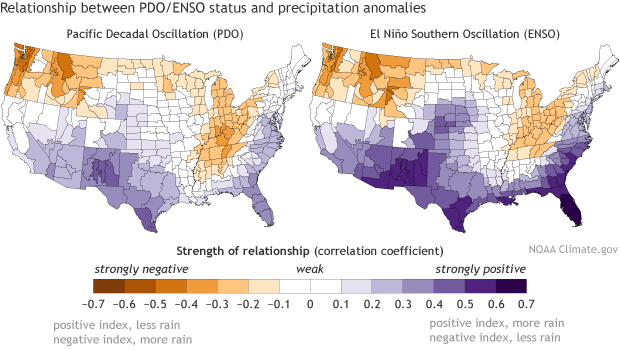
Correlation between precipitation anomalies and the Pacific Decadal Oscillation (left panel) and the El Niño-Southern Oscillation (right panel) during November-March from 1901-2014. The PDO has little additional influence on precipitation beyond what ENSO already explains. Image adapted by NOAA Climate.gov from original provided by Matt Newman based on NCEI Climate Division data.
However, rainfall over western North America, as seen in the images above, is better explained by ENSO than the PDO since there is a more direct physical connection (3). A major reason the PDO and ENSO impacts look similar is because ENSO is one of the three major flavors that make up the PDO Neapolitan itself!
Overall, the PDO index is a good way of getting a sense of how a bunch of different ocean and atmospheric processes are affecting the North Pacific Ocean. But it is important to remember, that it is the mixture of those processes that can impact weather and climate across the United States for instance, not the PDO itself.
Special thanks to Nate Mantua (NOAA/SFSC) for reviewing this post and to Matt Newman (NOAA/CIRES) for providing figures based on Newman et al. (2016).
Footnotes
(1) In the North Pacific, SST anomalies can develop to a greater depth in the ocean during winter than in summer because the Aleutian Low is strongest in winter, helping to mix the water to a deeper depth (a deep mixed layer). When the calendar shifts into spring and summer, the Aleutian Low weakens and moves north to be replaced by a high-pressure system, calmer weather and a shallower area of mixed water. It can be like installing a barrier in the ocean. Any water temperature anomalies underneath that wall get stuck, having to wait to dissipate until the following winter when the mixed layer deepens and that barrier doesn’t exist.
(2) The decadal changes in the Kuroshio current system are actually forced by winds in the North Pacific, associated with the Aleutian low, setting off slow moving, westward propagating oceanic Rossby waves in the upper ocean. These waves take three to ten years to cross the basin and show up as sea surface temperature anomalies in the western North Pacific.
(3) We’ve previously explained how sea surface temperature anomalies related to ENSO affect the Hadley circulation through increases in thunderstorm activity across the central/eastern equatorial Pacific Ocean. This can in turn impact weather and climate across the mid-latitudes. This does not hold true for the PDO. Sea surface temperature anomalies in the North Pacific do not affect thunderstorm activity since the water is too cold to begin with and the dynamics of the mid-to-high latitude atmospheric circulation is different from the tropical atmospheric circulation. This is why I say that the PDO has mainly local climate effects.
References
Alexander, M.A., and C. Deser, 1995: A mechanism for the recurrence of wintertime midlatitude SST anomalies. J. Phys. Oceanogr., 25, 122–137,
Mantua, N.J., S. R. Hare, Y. Zhang, J. M. Wallace, and R. C. Francis, 1997: A Pacific Interdecadal Climate Oscillation with Impacts on Salmon Production. Bull. Amer. Meteor. Soc., 78, 1069-1079.
Newman, M., M. A. Alexander, T. R. Ault, K. M. Cobb, C. Deser, E. Di Lorenzo, N. J. Mantua, A. J. Miller, S. Minobe, H. Nakamura, N. Schneider, D. J. Vimont, A. S. Phillips, J. D. Scott, and C. A. Smith, 2016: The Pacific Decadal Oscillation, Revisited. J. Climate, 29, 4399-4427
Kumar, A., H. Wang, W. Wang, Y. Xue, and Z.-Z. Hu, 2013: Does knowing the oceanic PDO phase help predict the atmospheric anomalies in subsequent months? J. Climate, 26, 1268-1285.
Wittenberg, A.T., A. Rosati, T.L. Delworth, G.A. Vecchi, and F. Zeng, 2014: ENSO Modulation: Is it Decadally Predictable? J. Climate, 27, 2667-2681.
Comments
PDO
RE: PDO
RE: RE: PDO
It's hard to tell what phase we're in without at least 2 or even 3 years shown to be in that phase, since there are occasional blips (short-lived reversals). It now appears that in 2014 we did change to the warm phase after having been in a cool phase since about 1999. About the duration, your sense is correct that it is not a set number of years, and can vary noticeably, as can be seen in the second figure above.
pdo
PDO
RE: PDO
Hi Victor,
The PDO has stayed positive since early 2014, as you say. See the site: research.jisao.washington.edu/pdo/PDO.latest . We don't yet have solid attribution for the persistence of drought in the Southeast.
Effect on rainfall
PDO and global temperatures
PDO and global temperatures
RE: PDO and global temperatures
Since the PDO is a cycle of warm and cool phases, its contribution to any longer term trends is minimal. However, the phase of the PDO could impact shorter-term trends depending on the phases, even while not impacting the longer term warming trend globally.
pdo
RE: pdo
Not sure I've heard anything about heading into a little ice age. While a low solar cycle can have an influence on global temperatures, its effect is most likely not as large as the underlying warming effect from human emissions of greenhouse gases
PDO
RE: PDO
Hi-- I asked Nate Mantua (now with NOAA) about this index and he confirmed to me that global warming signal is likely impacting this version of the PDO index. The influence is not large, but it is probably enough to transform some of those small, positive PDO values in recent years into negative PDO values.
"Neutral" is a designation of "near average." For ENSO, we designate -0.5 to +0.5 (Nino-3.4 index) as Neutral, but these thresholds are somewhat arbitrary. The same can be done for the PDO index, but I'm not aware of any effort to define thresholds for this index.
RE: RE: PDO
Warm and Cold Phase
RE: Warm and Cold Phase
You can find the monthly PDO index values at this site, and so you can calculate the annual values from those. The Japan Meteorological Agency provides an annual PDO index that may be useful for you. The years with positive values are "warm" years and those with negative values are "cold" years.
RE: Warm and Cold Phase
Parts of KY, IN, MI and New England
Interesting that these parts of the country are more influenced (at least precip-wise) by the PDO than ENSO. I would've it to be the Pacific Northwest.
PDO vs. ENSO
I am not sure how many of those differences are statistically significant, but if there are significant differences, I would speculate that the reason may be that the PDO is more closely connected with the canonical Pacific-North American (PNA) pattern. ENSO forces a similar pattern that maps onto the PNA, but it's not quite the classic PNA. As Michelle's post showed, the PNA has a strong influence on precipitation in the Tennessee and Kentucky region. Again, this is speculation, so this idea would have to be tested before it could be trusted.
Comments have been disabled on this article