How unusual is 2016's record-temperature three-peat, and will the hot streak continue in 2017?
Looking back on Earth’s global temperature over the past three years...2014: record warm—wow! 2015: record warm—wow!! 2016: record warm—holy cow!!!
In 2016, the annual global temperature reached a record high for the third year in a row, a remarkable occurrence rarely seen in the 137-year NOAA record and one not seen since the streak of record warmth (at the time) of 1939, 1940, and 1941.
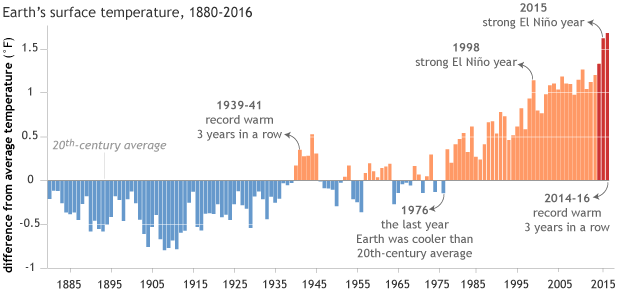
Each year's global surface temperature compared to the twentieth-century average from 1880-2016. The three hottest years on record (2014–16) are colored red. The last record-warm "three-peat" was the period from 1939–41. Due to global warming, those years don't even rank in the top 30 warmest on record. Graph by NOAA Climate.gov, based on data from NCEI's Climate at a Glance.
Those years, which ranked as third warmest, second warmest, and warmest, respectively, in 1941, now rank as 64th, 50th, and 38th warmest today. But back to the current streak…how did this happen?
If you guess long-term climate change—Yes! If you guess El Niño—Yes! Also correct. If you guess supermoons—umm, sorry, not so much.
The Background
First, Earth’s temperature has been rising at an average rate of 0.13°F each decade since the start of the record in 1880 and more than twice that rate (0.31°F) if you consider the past half century alone. That increase is due to long-term warming.
Second, natural climate cycles, the biggest player being the El Niño-Southern Oscillation (ENSO), cause global temperatures to temporarily rise (El Niño) or fall (La Niña). Generally, the stronger the El Niño or La Niña, the greater the impact will be on the average global temperature. Over time, the effects of El Niños and La Niñas balance each other out, so the net effect on long-term warming is negligible.
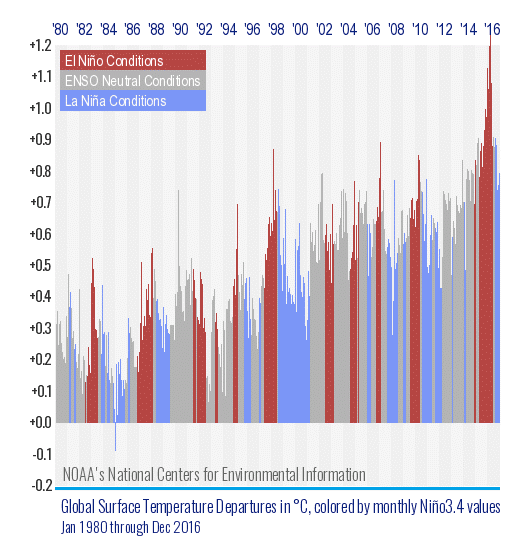
Monthly temperature departures from average color coded by the warm (red, El Niño) and cool (blue, La Niña) phases of the El Niño-Southern Oscillation climate pattern influencing the climate at the time. El Niño and La Niña months tend to be warmer or cooler, respectively, than their close neighbors. NOAA NCEI graph by Deke Arndt.
The Story
Near the end of 2014, one of the strongest El Niños since at least the mid-20th century, and the strongest since 1998, emerged in the eastern Pacific Ocean and lasted through late spring 2016. So not only was this a strong El Niño, it was the longest-lasting one since the Climate Prediction Center began tracking the phenomenon in 1950. This extreme intensity and duration led to the fall of lots of annual and monthly global temperature records. And when they fell, they fell hard.
Annual temperatures
With a couple of months in the El Niño phase at the end of the year—but still weak at this point—2014 broke the annual record set in 2010 (another year with El Niño by the way) by 0.07°F.
El Niño continued to strengthen throughout 2015 and was among the strongest on record by the end of the year. (Side lesson: there are a lot of complicated dynamics between the ocean and the atmosphere, but to simplify here, a strong and long-lived El Niño exposes a lot of warm water to the atmosphere. If you take away some of the details, it's like adding a subtle temporary floor furnace to the atmosphere.) With all the extra heat pumped into the atmosphere from the ocean, 2015 broke the annual record set in 2014 by an incredible 0.29°F, the widest margin on record.
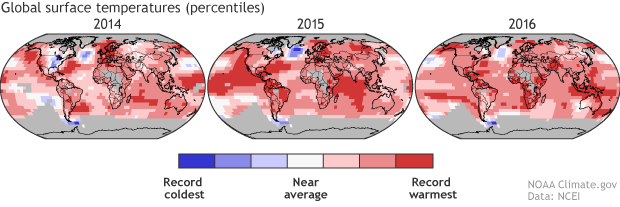
Global surface temperatures by percentiles (record coldest to record warmest) for 2014, 2015, and 2016. Despite each successive year setting a new global record, different places experienced different levels of warmth each year. NOAA Climate.gov image based on NCEI maps.
El Niño began to weaken around the beginning of 2016, officially ending in late spring. Often, the effects of the phenomenon continue to impact global temperatures for up to a few months after the event has ended because all of that added heat in the atmosphere doesn’t immediately go away. And as sometimes happens, a La Niña event emerged a few months after El Niño’s demise, bringing its cooling effect with it.
Because of its strength and lingering effects, the 2016 annual global temperature was influenced more by El Niño than by La Niña. And so, with the global temperature already elevated at the beginning of the year, 2016 set yet another annual global temperature record, albeit by a slimmer margin of 0.07°F.
But how does the 2016 temperature stack up against 1998, the year of the last strong El Niño? If we were comparing apples to apples, we would expect the temperatures to be roughly close to one another. But it’s not apples to apples: this is where the effect of long-term global warming can clearly be seen. Although each year started with a strong El Niño and ended with La Niña, 2016 was more than half a degree (0.56°F) warmer than 1998. That matches up well with the average decadal rate of warming. Even 2014 beat out 1998 by 0.19°F.
The monthly records
While three record warm years in a row is pretty incredible, monthly temperatures during these three years were equally astonishing. Lots of records were broken, several in dramatic fashion.
In the 28-month span between May 2014 and August 2016, 24 monthly global temperature records were broken. That includes 16 in a row (s-i-x-t-e-e-n!) from May 2015 to August 2016. Fourteen of the 15 largest all-time monthly temperatures departures were set during 2015 and 2016, with the highest in March 2016 (January 2007 tied for 10th warmest, and yes, El Niño was involved here too).
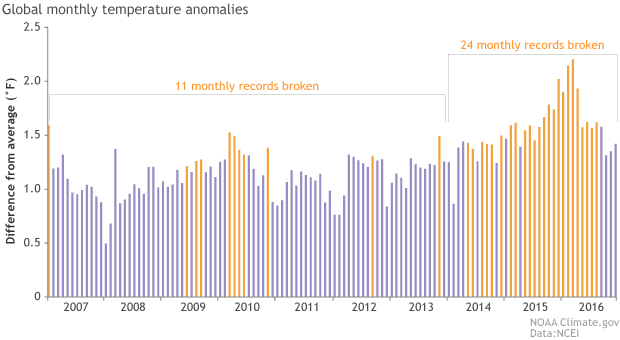
Monthly temperature anomalies (difference from average) from 2007-2016. Orange-gold bars indicate months that set a new temeprature record at the time they occurred. During the past three years, 24 months set new records for warmth. In some cases, monthly records set in 2014 were broken in 2015, and again 2016. NOAA Climate.gov graph, adapted from NCEI original by Deke Arndt.
El Niño is over. What now?
El Niños and La Niñas and other natural climate patterns are really difficult to predict far in advance. It is unknown exactly when they will occur, how long they will last, and how intense they will be. So it’s not really possible to know exactly how warm or cool next year, or the year after, or the year after that will be.
But underlying this uncertainty is the certainty that the annual global temperature record has been broken five times since the beginning of the 21st century and the certainty that the global temperature has been increasing around 0.3°F per decade over the past 50 years.
Although we don’t know when, the global annual temperature record will be broken again. Monthly global temperature records will be broken again. We will not see new global high temperature records every year, nor do we expect to. We probably won’t see a new record in 2017, but we probably will see one in the not so distant future.
Finally, it’s important to remember that the average global temperature is just that - an average. Different parts of the world will set new records at different times, and yes, we expect to see some records this year too. We expect a few of these will even be cold records. In some regions of the world, like the Arctic, temperatures are rising at a much higher rate than most other regions of the world. Increasing temperatures manifest into impacts, like melting glaciers and ice sheets that lead to sea level rise, among countless others. That won’t change—new record annual global temperatures or not.