May 2019 El Niño Update: Feliz Cumpleaños
Forecasters estimate a 70% chance that our current El Niño will continue through the summer, and a 55-60% chance it will extend into the fall.
Just a number
El Niño conditions were still evident across the tropical Pacific Ocean during April, as the sea surface temperature in the Niño3.4 region averaged about 0.7°C warmer than the long-term average (via the ERSSTv5 database). Most computer models predict that the ocean surface will stay warmer than average in the Niño3.4 region, with the majority of predictions remaining above the El Niño threshold of 0.5°C through next fall.
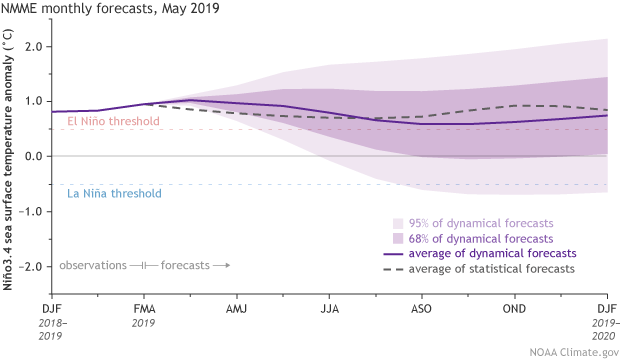
Climate model forecasts for the Niño3.4 Index. Dynamical model data (purple line) from the North American Multi-Model Ensemble (NMME): darker purple envelope shows the range of 68% of all model forecasts; lighter purple shows the range of 95% of all model forecasts. Statistical model data (dashed line) from CPC’s Consolidated SST Forecasts. NOAA Climate.gov image from CPC data.
However, there is a broad range of potential outcomes shown here, and we’re still within the spring predictability barrier, when forecast models have a tougher time making successful predictions, partly due to the tendency of ENSO to be in transition during the spring. We’re starting to pass that barrier, but we still bear it in mind when looking at forecasts made in early May.
Blow out your candles
The atmosphere also continued to reflect El Niño in April, with more clouds and rain forming over the warmer-than-average waters of the central tropical Pacific, and drier conditions over the far western Pacific and Indonesia, although this pattern was somewhat weaker than during February or March.
The near-surface winds in the tropical Pacific, the trade winds, were near average in April. The trade winds usually blow from the east to the west, keeping warm water piled up in the far western Pacific. Changes in these winds are a critical component of the El Niño system. When they weaken in the central Pacific, surface waters can warm, and sometimes allow a downwelling Kelvin wave to form: a large blob of warmer-than-average water that moves from the west to the east under the surface of the Pacific.
After a couple of months of weaker-than-average trade winds (what we expect during El Niño conditions), they were near average overall during April. This slight weakening of the typical El Niño signal is in part due to a reawakening Madden-Julian Oscillation (MJO) in the second half of April.
The MJO is an area of active storms and convection (rising air) that travels from west to east along the equator. It can circle the globe in about 30-60 days. We’ve talked about the MJO quite a bit on the ENSO Blog and climate.gov, since this pattern can affect US weather, and interact with El Niño and La Niña.
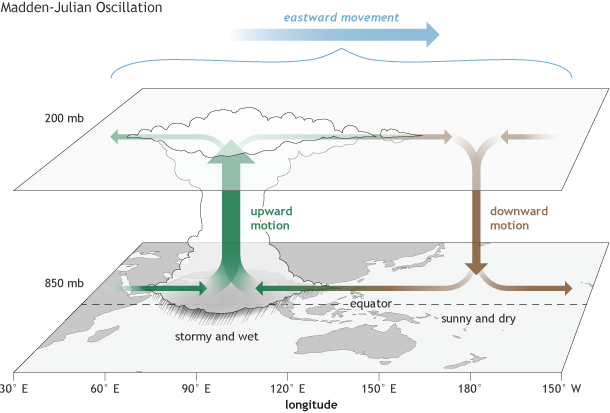
The surface and upper-atmosphere structure of the MJO for a period when the enhanced convective phase (thunderstorm cloud) is centered across the Indian Ocean and the suppressed convective phase is centered over the west-central Pacific Ocean. Horizontal arrows pointing left represent wind departures from average that are easterly, and arrows pointing right represent wind departures from average that are westerly. The entire system shifts eastward over time, eventually circling the globe and returning to its point of origin. Climate.gov drawing by Fiona Martin.
Near-surface air is drawn toward the MJO-related area of convection. So when the MJO is over the Indian Ocean, the trade winds in the west-central Pacific are stronger than average, because the inflow to the MJO reinforces them. But when the MJO moves into the central Pacific, the trade winds tend to be weaker, because the inflow to the MJO opposes them.
After going mostly quiet in mid-March, by mid-April the MJO was showing signs of re-development. The trade winds in the western Pacific during mid-late April were stronger than average (more east-to-west), consistent with what we’d expect when the center of MJO convection is in the Indian Ocean. However, during the first week of May, as the MJO moved into the Pacific, the trade winds weakened substantially in the west-central Pacific.
Over the hill
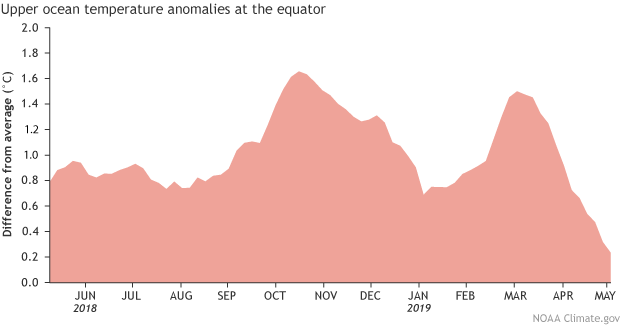
Area-averaged upper-ocean heat content anomaly (°C) in the equatorial Pacific (5°N-5°S, 180º-100ºW). The heat content anomaly is computed as the departure from the 1981-2010 base period pentad (5-day) means. Heat content has been elevated for the last 12 months, but recently decrease. Climate.gov figure from CPC data.
Over the past year, subsurface waters (from the surface down to about 1,000 feet) have remained warmer-than-average overall, but with some substantial increases and decreases, resembling a particularly brutal stage of the Tour de France. If the recent weakening in the trade winds does lead to a downwelling Kelvin wave and increases the subsurface anomalies, it could provide fuel to help this El Niño event to persist. Bikers beware, another uphill climb may be ahead of you.
Bon anniversaire
Lastly, happy 5th birthday to the ENSO Blog! We’ve learned a lot over the past 60 months, and we hope you have, too. We’ve reported on a slow-to-develop, but strong El Niño; consecutive weak La Niñas; and the current, weak El Niño. We’ve built an extensive catalog of posts on ENSO (the whole El Niño/La Niña system), other climate patterns, and many other climate-related topics. Check out our editor’s handy index page for a stroll down memory lane. And, never forget Tom’s three-post series on forecast verification.
The best part is that we have a long list of topics we’re looking forward to covering in future posts, and we’re happy to solicit suggestions in the comments section below on topics you would like us to cover. Thank you for reading us—we’ve had well over 2 million unique page views so far—otherwise, we’d just be yelling into the (trade) winds.
Comments
Excellent blog as always
RE: Excellent blog as always
Spring Predictability Barriers
spring barriers for sea ice forecasts
I hadn't made that connection before, although I am frequent reader of both blogs. Thanks for commenting!
ENSO affects Santa Catarina, Brazil
ENSO blogs and Kelvin waves
add more details
Anonymous
Rain late May?
RE: Rain late May?
Thanks for the report! The continued wet conditions in CA are certainly interesting. Another possible player is is the MJO which is cycling into phases that cause an extension of the North Pacific jet stream, so may be helping funnel precip toward CA.
Au contraire
RE: Au contraire
We will see.... at this point we're still anticipating westerly wind anomalies to shift eastward in the next week or so and warm the surface somewhat. In the last week we noticed Nino-3.4 go from 0.5C to 0.7C so some of that anticipation is playing out. We also notice continued coupling in convection with dry conditions over Indonesia and wetter conditions near the Date Line. Our probabilities indicate El Nino is likely in the summer, with probabilities diminishing as we get into the fall/winter, which imply more uncertainty in the outcomes.
BOM uses a different threshold for El Nino, so they require a stronger event to declare. This is certainly not the first time NOAA has declared an event and BOM has not.
Excelent
RE: Excelent
From looking at these maps (click 'precipitation' tab: https://www.cpc.ncep.noaa.gov/products/precip/CWlink/ENSO/regressions/geplr.shtml ), it looks like there is a signal for above-average precipitation for Paraguay during El Nino for this time of year (toggle over AMJ and MJJ in particular). So it's very interesting to hear that it's been happening and thanks for letting us know. We find that there isn't a strong association between the intensity of the impact and the strength of the El Nino. Folks can get significant impacts even with very marginal El Nino situations... take the Philippines for another example-- they've shown clear signs of drought since the El Nino onset earlier this year. Thanks again!
Current El Nino contributing to a winter pattern over the West?
Current El Nino contributing to a winter pattern over the West?
One of the difficulties of forecasting seasonal temperature out West is the prevalence and dominance of the "trend," which favors warmth (some combination of decadal changes and climate change). As you can see in these historical ENSO composites of temperature ( https://www.cpc.ncep.noaa.gov/products/precip/CWlink/ENSO/composites/ , click El Nino temperature and toggle over AMJ, MJJ), you can see the trend clearly favors above-average temperatures, but, historically, El Nino runs counter to that, helping to drive below-average temperatures over the Southwest and north-central US. In the last month (May), we've definitely seen some of those characteristics, so it's possible that El Nino is helping to drive some of the wetter, below-average temperatures in those regions. There are possibly other weather and climate factors too, so hard to say definitively without more focused research.
Just remembered typhoon Haiyan
Comments have been disabled on this article