June El Niño update: Damn the torpedoes, full speed ahead
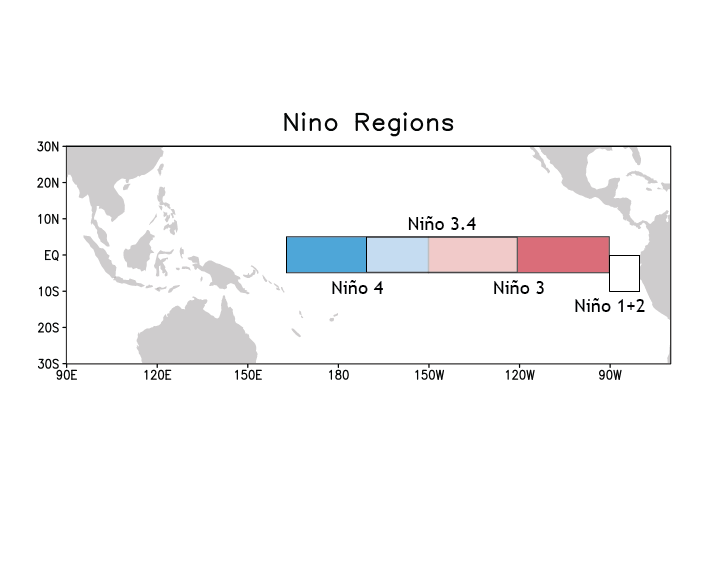
El Niño continues to pick up steam. NOAA CPC/IRI forecasters are now very confident that the event will continue through the fall (over 90% chance) and into the winter (~85% chance). Now that we’re emerging from the spring barrier, this month’s update provides a first guess of the potential strength of El Niño. It’s harder to predict the strength of the event than it is to predict its duration, so we are less confident about that, but forecasters currently favor a “strong” event for the fall/early winter. By “strong” we mean it’s expected that the three-month average sea surface temperature in the Niño3.4 region will peak at more than 1.5°C (2.7°F) above normal.
What’s happening right now?
During the month of May, we saw increases in a lot of the ENSO indicators. Sea surface temperature anomalies (the departure from average) were up all across the tropical Pacific, and the most recent Niño3.4 Index was 1.2°C. Both the lower-level and upper-level winds along the equator were substantially weaker than average last month, characteristic of El Niño’s weakened Walker Circulation. This feedback between the higher sea surface temperature anomalies and the atmosphere is critical to both perpetuating and strengthening an El Niño event, and to communicating the effects of El Niño to other areas of the globe.
Signs of another downwelling Kelvin wave have begun to appear in the upper levels of the equatorial Pacific. This reinforcing source of warmer-than-average waters follows the strong Kelvin wave that has been slowly moving east since February. The consistently warmer waters are reflective of the slower changes we’d expect to see when the ocean-atmosphere system has settled into an ENSO event, as opposed to the shorter-term changes that dominate the rest of the time.
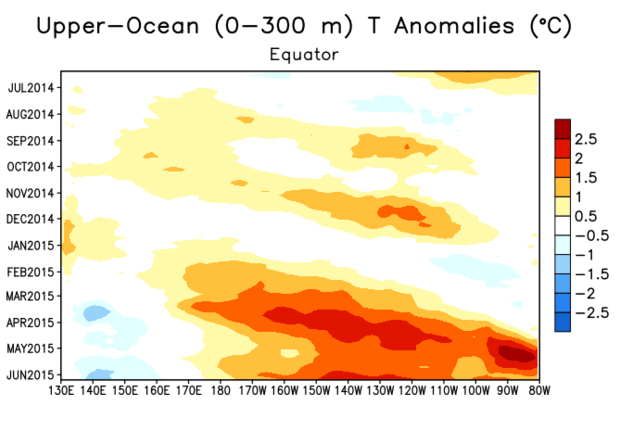
Hovmoeller plot showing the changes in upper-ocean heat content over the past year. The vertical axis shows time, starting in June 2014 (top) and going through June 2015 (bottom). Horizontal axis spans the equatorial Pacific Ocean, from 130°E to 80°W. Each row in the plot is the average temperature anomaly of the upper 300 m. For example, the last Kelvin wave (area of warmer-than-average waters) develops near the Date Line in March, and slowly moves eastward through time. For more on how to interpret these graphs, check out Tom’s post. CPC figure.
What signs are suggesting a possible strong event?
The physical observations I described above are a source of confidence that this event is continuing to build. Also, most climate models are forecasting a continued increase in Niño3.4 sea surface temperature anomalies, and many forecast a peak in the early winter above 1.5°, some above 2.0°C.
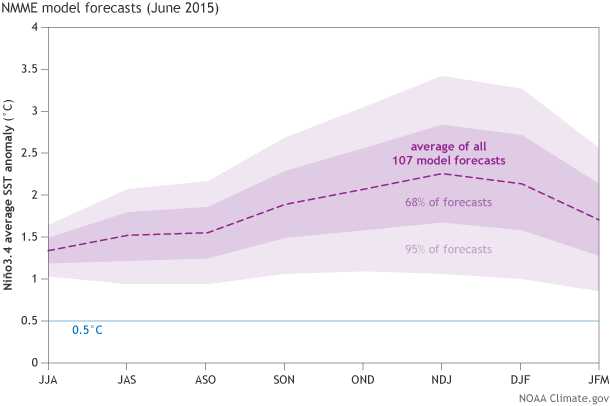
Climate model forecasts for the Niño3.4 Index, from the North American Multi-Model Ensemble (NMME). Darker purple envelope shows the range of 65% of all model forecasts; lighter purple shows the range of 98% of all model forecasts. NOAA Climate.gov image by Fiona Martin from CPC data.
It’s important to remember, though, that we only have a handful of strong El Niño events in the historical record—seven since 1950. And only three of those saw Niño3.4 index values of 2.0°C or higher: 1972-73, 1997-98 and 1982-83)*. Imagine if we’d only had seven hurricanes in the history of record-keeping; it would make it much harder to understand and predict how a future hurricane could develop. So, while we’re confident that this El Niño event will continue, there’s still plenty of uncertainty about how it will evolve.
That said… what would a strong event mean?
As Tony pointed out in our last post, ENSO impacts on North American weather and climate are most noticeable in the winter. This is largely because winter weather is governed more by large-scale processes (e.g. nor’easters) than summer weather, when local effects (e.g. isolated thunderstorms) tend to be more important. El Niño events affect the strength and position of the jet stream, and tilt the odds toward more rain than average along the West coast and in the Southeast during the winter.
El Niño loads the dice in favor of certain impacts, but it doesn’t guarantee them. However, stronger events tend to lead to more predictable effects. My brother asked me if he should repair the leaks in the roof of his campervan before he goes to Florida this winter… based on the ENSO forecast, I said yes. (I would probably have said yes anyway —who wants to stay in a drafty camper?— but that’s beside the point.)
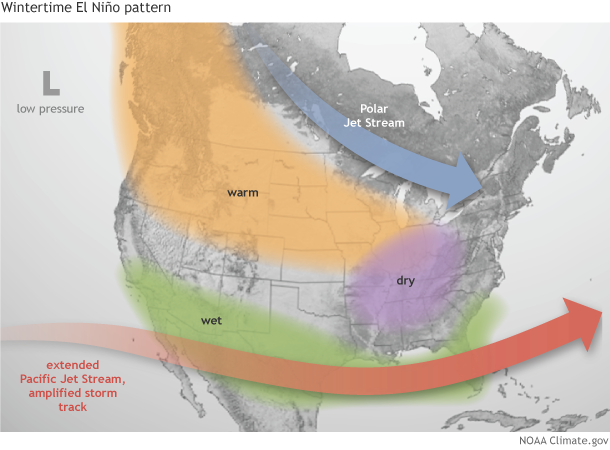
Changes in the winter atmosphere during El Niño. NOAA Climate.gov image by Fiona Martin.
Globally, this El Niño event is likely to lead to higher global temperatures, possibly record-breaking. On this, check out Deke Arndt’s post on our new sister blog, Beyond the Data. Also, as I mentioned last month, the tropical Pacific hurricane season is already breaking records, while the Atlantic hurricane season is forecast to be quieter than average—both effects linked to El Niño. For the coming summer (June-August), check out Tony’s post on potential temperature and precipitation impacts linked to El Niño.
Many, many different components are at work in the global climate system, making exact predictions impossible. However, the development of a climate phenomenon like El Niño can make some outcomes more likely than others, which is why we follow it so closely. We’ll keep you posted as this event continues.
*This is based on the current version of ERSST, ERSSTv3b. ERSSTv4 will be released next week, and may slightly change the ONI values (and therefore the number of events >1.5°C).
Comments
Harp and chemtrails disrupting weather in Cali
RE: Harp and chemtrails disrupting weather in Cali
California Extreme Precipitation Symposium
map!
RE: map!
el nino
June El Niño update: Damn the torpedoes, full speed ahead
EL NINO
Title
Thanks,Interesting..Maybe
RE: Thanks,Interesting..Maybe
NB weather
El Niño update
informacion
ERSSTv4
RE: ERSSTv4
June El Niño update: Damn the torpedoes, full speed ahead
RE: June El Niño update: Damn the torpedoes, full speed ahead
It is expected that the SOI will vary on intraseasonal timescales, even during a strong ENSO event. This is why we monitor several different indices and measurements to make our forecasts.
Wind anomalies
RE: Wind anomalies
It was not your imagination! Starting a couple of weeks ago, the Madden-Julian Oscillation (MJO) was in the phase that gave increased convection (cloudiness and thunderstorm activity) over the Indian Ocean, and that is a phase that tends to militate against El Nino. You are correct that the wind anomalies in both lower and upper atmophere, that have been showing a clear El Nino pattern, weakened in response to this MJO factor. The Southern Oscillation Index (SOI) became much more weakly negative than it had been just a few weeks earlier. Fortunately (if you like El Nino), the much heavier flywheel of the sea temperatures, both at and below the surface, do not change very quickly, so this latest "gunshot" against the event will not make much of a dent and undo what has been building up over the last several months. Furthermore, the MJO is predicted to change phase in the next week or so, so as to be less unfavorable to the El Nino, and maybe even favorable to it. When the MJO phase is in the central or eastern tropical Pacific, it helps support (or even strengthen) an El Nino. The MJO can weaken or strengthen an El Nino (or La Nina) when it stays in the same phase for a long time, such as over 1 month. But that rarely happens, as the MJO tends to propagate around the globe every 30-60 days or so.
Congratulations on noticing this very relevant, and likely relatively brief, interruption to the atmospheric patterns defining this El Nino.
California Central Valley ??
RE: California Central Valley ??
You are correct that increased rainfall this winter in the Central Valley is questionable. The extended Pacific jet stream tends to bring increased rainfall to mainly southern California and the southwestern States (including snowpack as well as rainfall at lower elevations), so the San Juaquin Valley is in a better position to get good rainfall than the Sacramento Valley. Each event plays out differently, however, and we can't expect all events to bring the same patterns of rainfall departure from normal. I would say there is reason for hope for California this winter, especially late winter (Jan-Mar) with this developing El Nino that is already at moderate strength before mid-summer.
RE: RE: California Central Valley ??
RE: RE: RE: California Central Valley ??
I couldn't agree more that anlogues are no way to make a forecast, with or without climate change. We had a blog about this during the course of the last year: check out http://www.climate.gov/news-features/blogs/enso/why-past-enso-cases-are…; But anlaogues are interesting and are not completely worthless or irrelevant. Despite climate change, most scientists would agree that so far, even with the amount of climate change we have already had, the ENSO phenomenon has not changed materially and has not begun playing by very different rules. There have possibly been trends in certain details, such as a greater tendency toward central Pacific El Nino events, but these have not been marked. Regarding the tendency for southern California to get above normal rainfall in late winter with moderate-plus or strong El Nino events, it shows up not only in past cases (analogues) but is also confirmed in dynamical model experiments using the equations of the ocean and atmosphere. But if your point is that there is appreciable uncertainty in the forecast for late winter precipiation in California, hey, I'm 100% in agreement! We should be hopeful, but not get our hopes up too much.
RE: California Central Valley ??
Jet Stream anomolies
RE: Jet Stream anomolies
Again, I agree that analogues should not be used as the sole source of a real-time forecast, unless there is nothing else available. There is considerable uncertainty associated with the winter forecast for precipitation in California, but the tilt of the odds toward good results in the southern part of the state nonetheless exists, due to the expected extension of the Pacific jet stream even in the presence of climate change that may well be altering the usual jet patterns farther east in the US during winter.
Rainfall for NorCal
RE: Rainfall for NorCal
In the strongest El Nino events, northern as well as southern Calif have received above average precipitation. In moderate El Nino events, central California may get good rains, but north of San Francisco the odds are not so good. The reason northern California is often left out of the forecast, is because it is in a transition zone between the region farther south that has the enhanced chance for above average precipitation (especially in late winter), and the region farther north (Oregon and Washington) that tend to be a bit drier than average during winter with El Nino. We're sorry, but that is what mother nature does, ON AVERAGE. In any particular case, it may or may not turn out this way, but over a large set of El Nino cases that is the tendency, based not only on empirical evidence (historical observations) but on dynamical (i.e. physical) modeling results where physical equations are used. As far as how strong the current El Nino may become by winter, it is somewhat up for grabs. At least a moderate event appears likely, but whether it will grow to become one of the very strong ones is unable to be resolved at this time. If it does become strong (with Nino3.4 and Nino3 index values of 1.5 or even 2 degrees C above average), central California will be in a better position to get a wet winter, and even farther north in California would have a decent shot at it. With the decadal climate possibly shifted from what it was between 1999 and early 2014, California also might stop having as bad a long-term drought situation. But we are not sure the decadal climate has shifted (I'm talking about the Pacific Decadal Oscillation, or PDO), since it needs to stay shifted for at least 2 or 3 years to be sure it is not just a 1 to 2 year break in the general 15-or-so year tendency. In any case, we hope California in general will get some relief from the drought, both from the El Nino and possibly from a shift of the PDO to positive phase after 1 to 2 decades in mainly negative phase. A lot going on here and it will be interesting to see the outcome!
pacific blob
RE: pacific blob
We don't see any evidence that "the blob" (the warm sea surface temperatures in the Gulf of Alaska) will impact this El Nino.
Costa Rica
RE: Costa Rica
During El Nino, the large scale pattern favors drier than average conditions over Central America and the Caribbean. However, typical El Nino impacts are usually best seen in "seasonal" or an average of 3 months of data. What you are pointing out appears to have been a significant, shorter-term weather event.
Over the last 30 day average, here is the broader larger scale patttern as estimated by TRMM (as of this posting, the dates are shown from June 9-July 8th 2015):
http://www.cpc.ncep.noaa.gov/products/fews/central_america/trmm_rainfal…
From this snap shot, most of the larger region is drier than average (i.e. consistent with El Nino). But over Costa Rica, I see a wetter than average signal, which appaers to be mostly the exception rather than the rule.
Overall, it is importat to realize that an El Nino does not guarantee impacts and there will be exceptions even during a stronger El Nino.
El Niño indices (ERSSTv3b vs ERSSTv4) and region (3.4 vs 3)
RE: El Niño indices (ERSSTv3b vs ERSSTv4) and region (3.4 vs 3)
Are you aware of a past archive for JMA forecasts/outlooks? I’ve looked for it before on the web and wasn’t able to find it. Therefore, it’s hard to compare forecasts with JMA so I can’t answer that part of your question... CPC has an archive of past outlooks here:
http://www.cpc.ncep.noaa.gov/products/analysis_monitoring/enso_advisory… (click "Archive" link).
NOAA CPC/IRI declared El Nino in March 2015. It is our opinion that this is the start of El Nino irrespective of the ERSST dataset. This is because we do not declare ENSO events -- from month-to-month -- on the basis of a single index (or dataset) that is SST only (covered here: http://www.climate.gov/news-features/blogs/enso/why-are-there-so-many-e… and here: http://www.climate.gov/news-features/blogs/enso/decembers-enso-update-c…)
The Oceanic Nino Index (based on ERSST) is only one index to monitor ENSO and it is an simple way of classifying historical events and drawing comparisons. However, please always keep in mind that no index (or single dataset) is foolproof and ENSO is a *coupled* (meaning ocean + atmosphere) phenomenon, so for the weaker/borderline events in particular, we think it is important to consider other ENSO indices in addition to the SST based ones. In late 2014, we did not see a clear atmospheric response, so we did not declare an El Nino (http://www.climate.gov/news-features/blogs/enso/do-recent-global-precip…).
Since March 2015, we have seen both the tropical ocean and atmospheric indices aligned and more clearly exhibiting coupled behavior, which is why we have been calling it an El Nino. Also, our forecast probabilities for El Nino were fairly elevated (40-50%) prior to March (Feb forecast: http://iri.columbia.edu/our-expertise/climate/forecasts/enso/2015-Febru…), so we don't think it's accurate to say we never saw it coming.
A final (more minor point), recent values of the ONI will continue to change when the climatology changes. ONI values for 2014-15 will change slightly until the climatology becomes fixed in the year ~2030. More details here: http://www.cpc.ncep.noaa.gov/products/analysis_monitoring/ensostuff/ONI…
Comments have been disabled on this article