Global climate summary for September 2023
Temperature highlights
Globally, September 2023 was the warmest September in the 174-year NOAA record. The year-to-date (January–September) global surface temperature ranked as the warmest such period on record. According to NCEI’s Global Annual Temperature Outlook and data through September, there is a greater than 99% probability that 2023 will rank as the warmest year on record.
"September 2023 was the fourth month in a row of record-warm global temperatures,” said NOAA Chief Scientist Dr. Sarah Kapnick. “Not only was it the warmest September on record, it was far and away the most atypically warm month of any in NOAA’s 174 years of climate keeping. To put it another way, September 2023 was warmer than the average July from 2001-2010."
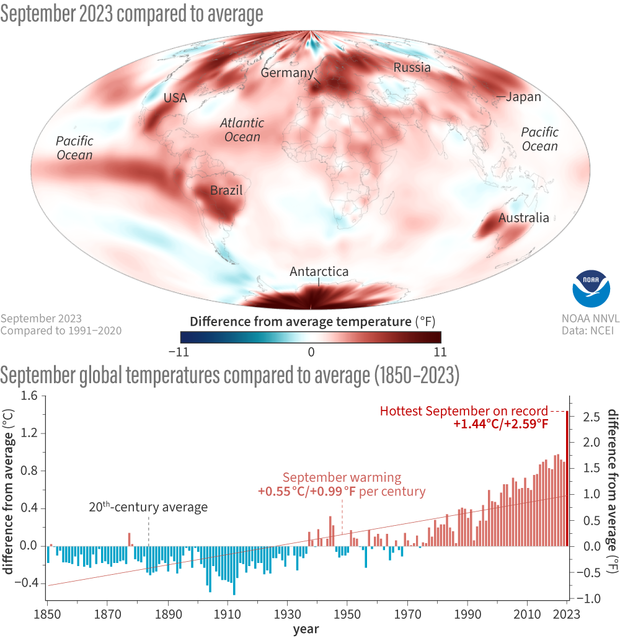
(top) Surface temperatures in September 2023 compared to the 1991-2023 average. Many areas were warmer than average (red colors). Only a handful of locations were cooler than average (blue). (bottom) September temperature compared to the 20th-century average from 1850 to 2023. Septembers have grown warmer at a rate of nearly 1 degree Fahrenheit (0.6 degrees Celsius) per century over the modern temperature record. NOAA Climate.gov map and graph, based on data from NOAA National Centers for Environmental Information.
The September global surface temperature was 2.59°F (1.44°C) above the 20th-century average of 59.0°F (15.0°C) and ranks as the warmest September in NOAA’s 174-year record. This was 0.83°F (0.46°C) above the previous record from September 2020 and marks the highest monthly global temperature anomaly of any month on record. The September 2023 global temperature anomaly surpassed the previous record-high monthly anomaly from March 2016 by 0.16°F (0.09°C). September 2023 marked the 49th-consecutive September and the 535th-consecutive month with temperatures above the 20th-century average.
North America, South America, Europe and Africa each had their warmest September on record. Asia had its second-warmest September, while September in Oceania ranked third warmest. For the sixth consecutive month, September saw a record-high monthly global ocean surface temperature. September 2023 tied August 2023 for the highest monthly sea surface temperature anomaly (+1.85°F or +1.03°C) of any month in NOAA’s 174-year record. Antarctica had its warmest September, while September in the Arctic ranked second warmest on record.
Temperatures were above average throughout most of North America, South America, Europe, Africa, Asia, Oceania and Antarctica. Parts of Europe, southern and north-central North America, northern and central South America, western and eastern Africa, southwestern and central eastern Asia, southwestern Oceania and Antarctica experienced record-warm temperatures this month. Sea surface temperatures were above average across much of the northern, western and southwestern Pacific as well as the Atlantic and the Indian Ocean. Record-warm temperatures covered 20% of the world's surface this September, which was the highest percentage of any month since the start of records in 1951.
Temperatures were near to cooler than average across parts of southern South America and central Russia. Sea surface temperatures were near to below average over parts of the southeastern Pacific Ocean. Less than 1% of the world's surface had a record-cold September.
Global Precipitation
- The ongoing El Niño dominated the rainfall anomaly patterns from the eastern Indian Ocean, across the tropical Pacific, and into Central America and northern South America.
- The South Asian Monsoon was wetter than average over land, and drier to the south over the ocean, intertwined with the ENSO pattern.
- The European drought continued, but floods in Greece and Libya were tied to a warm Mediterranean and a tropical-like circulation.
- The rainfall intensity of the global Intertropical Convergence Zone (ITCZ) set a record for September due to global warming and the current El Niño.
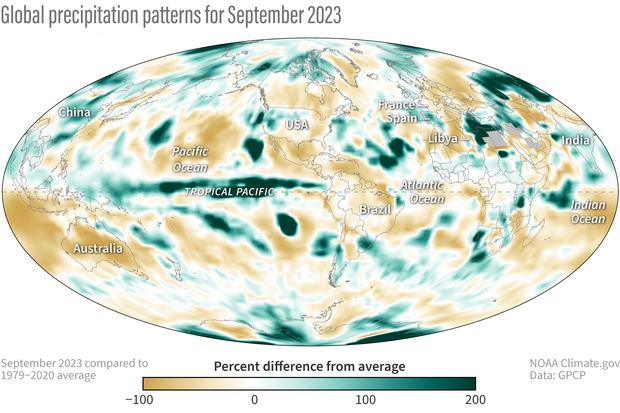
Total precipitation in September 2023 as a percent difference from the long-term average for that location. Places that received less than 100 percent of their normal September precipitation are colored brown, and places where precipitation was up to 200 percent or more above average are blue-green. The wetter-than-average conditions in the central and eastern Pacific at the equator are a sign of the ongoing El Niño.
The ongoing El Niño dominated rainfall anomaly patterns from the eastern Indian Ocean, across the tropical Pacific and into Central America and northern South America. The South Asian Monsoon was wetter than average over land and drier to the south over the ocean. Drought in Europe continued, but floods in Greece and Libya were tied to a warm Mediterranean and a tropical-like circulation pattern. The rainfall intensity of the global Intertropical Convergence Zone (ITCZ) set a record for September due to global warming combined with current El Niño conditions.
The precipitation pattern across the globe for this September had a very strong ITCZ across the Pacific and the typical Asian Monsoon distribution of strong rains across the Indian sub-continent eastward across Indochina and southern China. In the Atlantic (and the western Pacific), one can see fingers of rainfall associated with tropical cyclone tracks. The anomaly maps also show that the Asian Monsoon across South Asia was wetter than normal from India eastward. These rainier-than-average areas were associated with flooding, often related to tropical cyclones, or even just remnants of these storms, moving through the areas. This was especially felt this month with flooding in various areas along the South China coast, including Hong Kong. Immediately south of the positive monsoon anomaly lies a strong east-west negative anomaly centered just to the south of the equator. This couplet expressed the rainfall effect of the close-in north-south monsoon circulation for this month. A broader rainfall deficit extended over much of the South Indian Ocean and Australia and that represents the large-scale descent zone (apparently also stronger than normal) this September.
For more highlights of the September global climate, including sea ice extents, and extreme events, visit NOAA National Center for Environmental Information's Monthly Climate Reports page.