Somewhat. Very. Extremely. How likely is it that 2015 will be the new warmest year on record?
Anthony Arguez1, Scott Applequist1, Michael C. Kruk2, Michael F. Squires1, and Russell S. Vose1
Global surface temperatures have remained at or near record-warm levels throughout 2015, leading many to prognosticate that 2015 will eclipse 2014 as the warmest year on record1-3, perhaps by a relatively large margin.
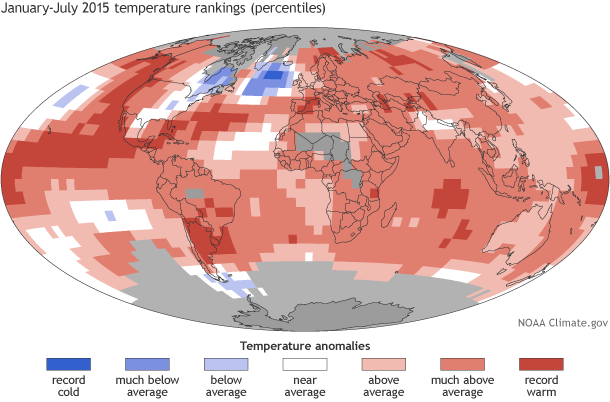
Much of the globe was record warm (darkest red) from January-July 2015, setting the stage for a new warmest year on record. Map by NOAA Climate.gov, based on NCEI data.
Based on the latest data from NOAA’s global surface temperature dataset (NOAAGlobalTemp), the 2015 global temperature average through July is running 0.09°C (0.16°F) above the 2014 average and 0.13°C above the January-July 2014 average. That might not seem like a lot, but 2014 eclipsed 2010 as the warmest year on record by an even smaller margin, 0.04°C.
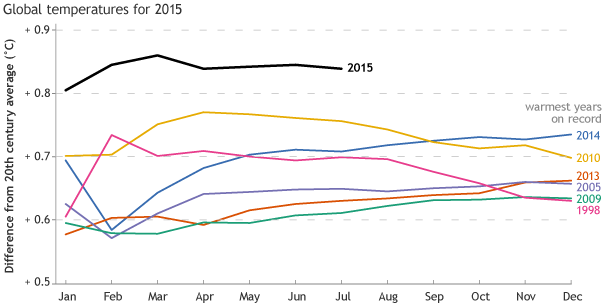
Monthly temperatures for 2015 to date compared to the twentieth-century average (black line). This year’s temperatures are running well above the current warmest years on record. Climate.gov graph, based on data from Deke Arndt, NCEI.
The strong El Niño event currently underway in the tropical Pacific Ocean is another leading indicator that 2015 may become the warmest year on record: El Niño events typically coincide with warm conditions globally.
These circumstances raise an interesting question: given the global surface temperature data through July 2015, what is the likelihood that 2015 will be the warmest year on record? A few of us at NOAA’s National Centers for Environmental Information (NCEI) decided to investigate.
To answer this question, we consider two approaches that rely only on historical statistics that describe how the remainder of the year may play out.
In other words, we don’t rely on any physical predictors such as El Niño conditions or forecasts of future weather or climate. We use only the well-documented, quality-controlled historical monthly global surface temperature data archived at NCEI.
First approach
The first approach looks at this problem from the vantage point of holding on to a lead. Specifically, the January-July 2015 global temperature average leads all previous full-year averages by at least 0.09°C. Can it hold on? This notion of holding on to a lead or improbable comebacks is a common theme across virtually all sports. For example, if your favorite football team is leading 49-0 at halftime, you are likely to be much more confident in the outcome compared to a 10-7 lead in the first quarter or even a 24-21 lead midway through the fourth quarter. Yet comebacks do happen, and we celebrate them because they are so remarkable, i.e., improbable.
Using the current version of NOAAGlobalTemp, we can look at previous instances in which the January-July average for a given year surpassed all previous annual averages. For this case study, we'll only count January-July averages since 1950 because in the first few decades of a time series, it’s easier to set a new record. (Less competition.) It is much more unlikely – all things being equal – to break a record once you’ve accumulated 70+ years of data.
2015’s lead on the current record-warmest year is 0.09°C. How many other years were in that ballpark, with a lead of say, at least half that much? Since 1950, there are only 5 cases (not including 2015) in which the January-July average exceeded all previous annual averages by at least 0.04°C: 1983, 1988,1990, 1998, and 2010.
| Year | Jan-Jul lead | Held on to break annual record by… |
| 1983 | 0.05° | 0.04° |
| 1988 | 0.04° | 0.01° |
| 1990 | 0.07° | 0.06° |
| 1998 | 0.17° | 0.11° |
| 2010 | 0.09° | 0.04° |
| 2015 | 0.09 ° | To be determined… |
Interestingly, all 5 years did hold on to become the warmest year on record, but they did so by a smaller margin than their January-July lead. Margins ranged from 0.01°C for 1988 (surpassing 1987) to 0.11°C for 1998 (surpassing 1997).
Thus, if recent history is any guide, 2015 should go on to become the warmest year on record, but perhaps by a margin less than 0.09°C.
Second Approach
A more robust approach to predicting the temperature outcome of 2015 is to estimate the probability that 2015 will be warmer than the current record holder, 2014. This approach involves characterizing possible outcomes for the remaining months of the year, August-December 2015, creating plausible scenarios that show how 2015 would either hold on to the lead or go down in defeat.
Remember that we’ve said we aren’t using any weather or climate forecast models for this analysis. So how are we going to describe possible temperature outcomes for the rest of the year? This is where statistics comes in. We are going to predict possible outcomes for 2015 based on what the historical record says about how widely the global temperature anomaly has varied from month to month in the past. Once we’ve created these plausible scenarios, we simply calculate the percentage of them in which 2015 holds on to its current lead and breaks the 2014 record.
To estimate this probability, we use a three-step approach very similar to previous NOAA research on characterizing the uncertainty of annual ranks4.
Step 1: Account for the long-term warming signal
The statistical techniques we want to use only work on data that are “stationary,” meaning no major long-term upswings or downswings. So the first thing we have to do is calculate the long-term trend in global surface temperatures and subtract it from the time series. (For the math wonks out there, the technique we used is called Empirical Mode Decomposition).
Step 2: Describe how widely monthly temperatures have fluctuated in the past
Now we have a time series of monthly temperature anomalies from 1880 to July 2015 with the long-term warming signal separated out. We use it to describe how much the global temperature anomaly typically changes from one month to the next, or over a few months at time.
The technique (again, for the wonks, it’s called autoregressive moving-average modeling) uses what has happened in the past to come up with a set of mathematical guidelines for how much the temperature is allowed to fluctuate within a particular span of time.
We use those guidelines in the final step.
Step 3: Describe thousands of plausible August-December temperature outcomes
We’ve developed a set of guidelines for what’s plausible based on what has happened in the past. For the final step, called Monte Carlo simulation, we use the guidelines to generate 10,000 different plausible August-December values, and then average them with the January-July observations for 2015. That gives us 10,000 possibilities for the 2015 annual average temperature anomaly. Finally, we count how many of these possibilities results in 2015 setting a new temperature record.
2015 extremely unlikely to lose its lead
Following this three-step approach, we estimate a 97% probability that 2015 will become the warmest year on record. The graph and bar chart below summarize the distribution of the simulations for each month (top) as well as the resulting annual anomalies (bottom). Note that the values are anomalies relative to the corresponding 1971-2000 averages.
(top) Observed monthly temperature anomalies for January-July 2015 (solid dots) and projected August-December values (open dots show the median; 95% of the simulated values range along the vertical bars). Using the simulated medians, the 2015 anomaly (orange line) will easily top 2014 (red line). The August-December anomaly could drop below 0.4°C (blue dashed line), and 2015 would still tie for the warmest year on record. (bottom) Out of 10,000 plausible annual outcomes, only a few percent result in 2015 losing its lead over 2014.
Notably, the median simulation value for each month, as well as every observed value from January-July 2015, is greater than the 2014 annual anomaly of 0.50°C. August-December anomalies would have to average ~0.37°C for 2015’s annual anomaly to equal that of 2014. Incidentally, monthly anomalies have not been below 0.37°C since April 2013 except for a one-month swing in February 2014.
Many youth sports have a so-called “mercy rule” in which a game can end early —and a victor declared—if one team has built a sizeable lead, e.g., when a little league baseball team leads by 10 runs after 5 innings. Of course, the atmosphere and oceans observe no such mercy rule, but is it too early to declare a victor?
Rather than calling the game early, climate scientists prefer to dabble in the world of probability. The Intergovernmental Panel on Climate Change’s (IPCC’s) Fifth Assessment Report uses specific labels to characterize the probability that certain statements are statistically true.
Using the IPCC definitions, we would state that it is “extremely likely” that 2015 will eclipse 2014 as the warmest year on record. Based on the analyses presented above, the historical data suggest it would take a remarkable and abrupt reversal in the NOAAGlobalTemp time series over the remainder of the year to upend 2015’s drive toward record-breaking status. In other words, it appears extremely unlikely that 2015 will lose its commanding lead.
References
1Washington Post, 2015: July was the hottest month in Earth’s hottest year on record so far. Accessed 31 August 2015. [Available online at http://www.washingtonpost.com/blogs/capital-weather-gang/wp/2015/08/17/july-was-likely-earths-warmest-month-in-whats-destined-to-be-earths-warmest-year/]
2The Guardian, 2015: Climate scientists say 2015 on track to be warmest year on record. Accessed 31 August 2015. [Available online at http://www.theguardian.com/environment/2015/jul/21/climate-scientists-say-2015-on-track-to-be-warmest-year-on-record]
3Climate Central, 2015: 2015 Edges Closer to Warmest Year on Record. Accessed 31 August 2015. [Available online at http://www.climatecentral.org/news/2015-edges-closer-warmest-year-19355]
4Arguez, A, T. R. Karl, M. F. Squires, and R. S. Vose, 2013: Uncertainty in Annual Rankings from NOAA’s Global Temperature Time Series. Geophysical Research Letters, 40, 5965–5969.
5IPCC, Climate Change 2013: The Physical Science Basis. Contribution of Working Group I to the Fifth Assessment Report of the Intergovernmental Panel on Climate Change, T. F. Stocker, D. Qin, G.-K. Plattner, M. Tignor, S.K. Allen, J. Boschung, A. Nauels, Y. Xia, V. Bex and P.M. Midgley, Eds. (Cambridge University Press, Cambridge, United Kingdom and New York, NY, USA, 2013).
Author affiliation
1NOAA’s National Center for Environmental Information
2ERT, Inc.
Related stories
How will El Niño affect 2015’s placement among the warmest years on record?
Is Second Place Really 'First Loser'?