December 2021 La Niña update: visual aids
La Niña continues as the Northern Hemisphere heads into winter, and forecasters are confident that it will hang around through the rest of the winter. This La Niña, the second in two years, will likely transition to ENSO-neutral sometime in the spring. There’s about a 60% chance the late spring and summer will feature neutral conditions.
Magnifying glass
Time for a closer look at the tropical Pacific, the home of the El Niño-Southern Oscillation climate pattern!
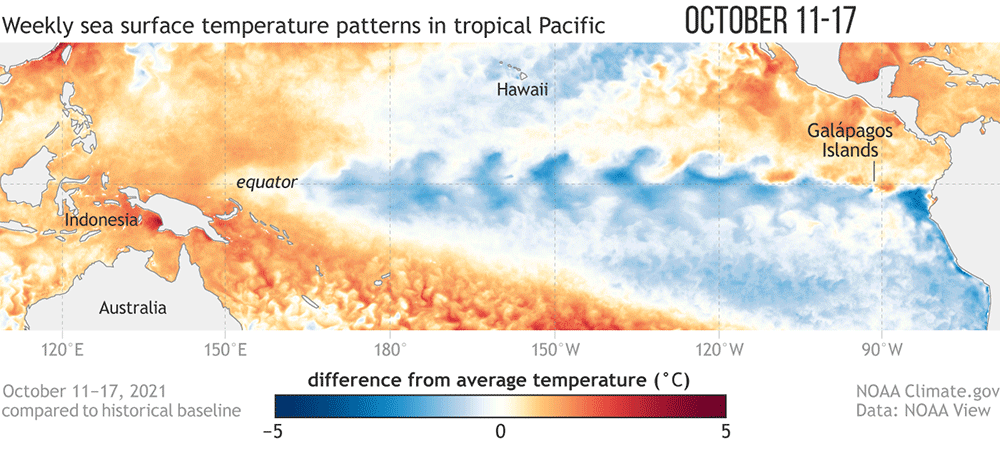
Sea surface temperature difference from the long-term average from mid-October 2021 to early December. Graphic by Climate.gov, based on data from NOAA’s Environmental Visualization Lab. Description of historical baseline period here.
La Niña’s hallmark cooler-than-average ocean surface is readily apparent across much of the tropical Pacific. Over the past few weeks, cool anomalies have increased in the eastern Pacific, and in general we see a well-established La Niña pattern. Also characteristic of La Niña is the warmer-than-average surface temperatures in the far western Pacific.
The wavy features in the animation above are called tropical instability waves. The equatorial eastern Pacific is usually cooler than the water just to the north and south, and cooler than the water in the far western Pacific. (Scientists refer to this region as the “cold tongue,” unfortunately.) This cooler surface right along the equator is due to cold water upwelling from the deep ocean. Any time there is a temperature difference, or gradient, between cold and warm, nature wants to smooth it out, and tropical instability waves help to mix the cooler equatorial surface with the warmer off-equatorial water to the north and south.
During La Niña, the cold tongue is even colder (shudder), so we often see prominent tropical instability wave action. These waves move relatively quickly, so they usually don’t show up in monthly or seasonal sea surface temperature maps.
Binoculars
The sea surface temperature in the Niño-3.4 region of the tropical Pacific, our primary ENSO monitoring index, was about 0.9 °C cooler than the long-term (1991–2020) average. This is according to ERSSTv5, our most reliable dataset, and comfortably within the La Niña category of more than 0.5 °C cooler than average. Forecasters are confident that La Niña will continue for the next few months, partly based on computer model predictions. There is also a large pool of cooler-than-average water under the surface, adding confidence that La Niña’s demise is not imminent.
Forecasters think the most likely scenario is for La Niña to transition to neutral by the late spring. Neutral is the most common state for ENSO in the spring, and most computer models predict the Niño-3.4 Index to be in the neutral range (between -0.5 and 0.5 °C) by the April–June season.
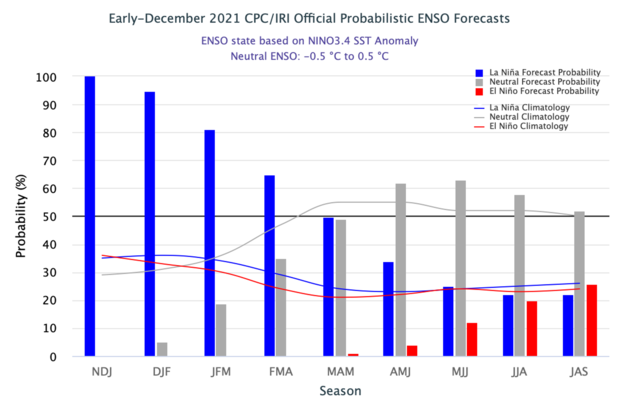
The official CPC/IRI ENSO probability forecast. The bars show the seasonal chances for each possible ENSO state—El Niño (red), La Niña (blue), and neutral (gray) from late fall 2021 through summer 2022. The forecast is based on a consensus of CPC and IRI forecasters, and it is updated during the first half of the month, in association with the official CPC/IRI ENSO Diagnostic Discussion. It is based on observational and predictive information from early in the month and from the previous month. Image from IRI.
We spend so much time and energy on El Niño and La Niña because they have a substantial impact on winter weather and climate around the globe. (Also, because they’re interesting!) La Niña shifts the Pacific jet stream, the fast-moving river of air that steers storms across North America. Specifically, during La Niña, the jet stream retracts to the west, and an area of high pressure tends to form in the north Pacific. These changes lead to a reduced number of storms coming onshore along the southwestern U.S. coast and hence drier conditions. On the other hand, the storm track tends to get deflected to the north, leading to wetter conditions in the Pacific Northwest. For lots more detail about how this works, check out Tom’s post on La Niña and the jet stream.
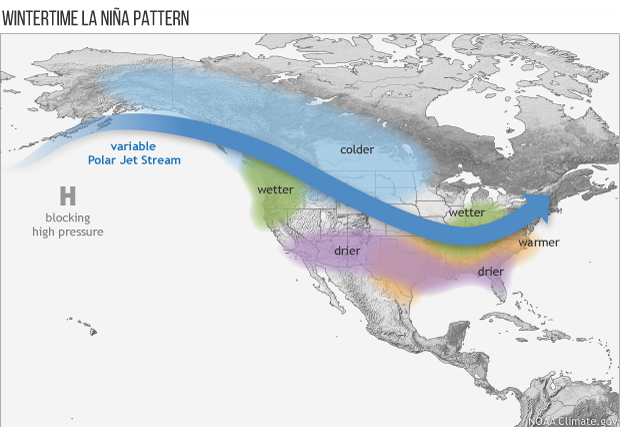
Average location of the jet stream and typical temperature and precipitation impacts during La Niña winter over North America. Map by Fiona Martin for NOAA Climate.gov.
The outlook for this winter’s climate in the U.S. was detailed by Mike Halpert in his recent post. Mike discusses the higher chance of dry conditions throughout the southern tier, a hallmark of La Niña. Also, for something you could probably see with your naked eyes, check out Tom’s discussion of the December 2021 outlook.
Telescope
Since La Niña is linked to drier conditions in the southern tier of the U.S., it can exacerbate drought. The current drought outlook does not expect relief for the severe drought in the Southwest this winter and is anticipating the expansion of drought eastward into Texas and Oklahoma.
Can we make any predictions about the state of ENSO for the winter of 2022–23? Not at the moment. Most of our computer models do not extend out that far, and the evolution from past La Niña events does not give us a clear picture. Overall, of the 12 first-year La Niñas in our historical record, four lasted only one year. Eight turned into double-dip La Niña, just like our current event. Of those, two recurred for a third year (triple-dip?). Nat dug into the science behind La Niña’s tendency to recur in consecutive winters in this post.
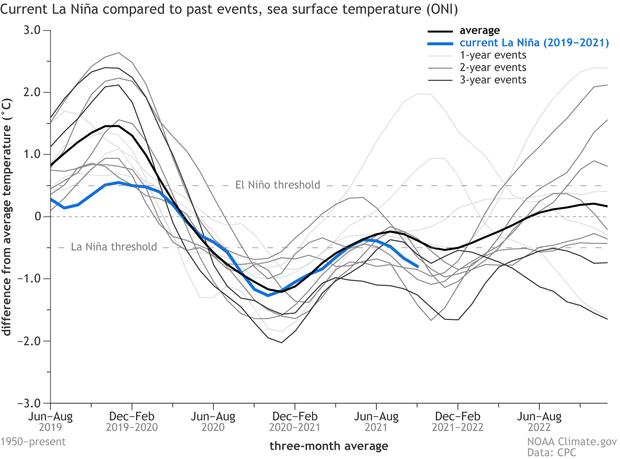
This graph shows 3-month-average sea surface temperature anomalies in the Niño 3.4 region of the tropical Pacific (the Oceanic Niño Index) for 2019–21 (blue line) and all other years (gray lines) based on the twelve first-year La Niña winters since 1950. The average of all twelve is shown by the black line. Four La Niñas lasted only one year (light gray lines), six lasted two years (medium gray), and two recurred for three years in a row (dark gray). Climate.gov graph inspired by original from Mike McPhaden.
One interesting thing to note about La Niña 2020–22 is that, unlike the other 11, it did not follow a full-blown El Niño. The tropical Pacific was warmer than average in 2019–2020 but did not meet El Niño thresholds.
Official Friend-of-the-Blog Mike McPhaden had this to say about recurring La Niña in general and this year in specific: "The likelihood of a double-dip La Niña increases for stronger preceding El Niños because the subsurface heat content in the equatorial band is usually more depleted following strong El Niños, providing extra inertia to sustain subsequent surface cooling over multi-year periods. What then accounts for the current 2-year cold event, which was preceded by only very weak El Niño-like warming, is an interesting research topic."
And so, as much as we’d like to get an idea of the next winter, it’s still too soon. The minute forecasters have a clearer picture, though, we’ll pass it on to you!
Comments
Weather
Does this mean that we are going to have a blow average servse weather season if it strays dryer then average
It depends where you are…
It depends where you are.... severe weather/tornado season doesn't really start ramping up until the spring. Here is a previous article on the subject:
https://www.climate.gov/news-features/blogs/enso/enso-and-tornadoes
Northern California precipitation
I saw in the past blog that wetter than average autumns can be the norm in La Nina, referring to the October atmospheric river that hit Northern California. This recent heavy Sierra snowfall, and possibly continued snowfall, has been quite a welcome surprise for this layman reader following the blog. However, this snowfall still seems to follow the normal model of La Nina, correct? The real test (for those of us that like to see snow beat the models, for purposes of winter/summer recreation) seems to be coming in January and on?
Love reading the blogs, great work!
Thanks, Cory! Based on this…
Thanks, Cory! Based on this earlier blog post about snow during La Niña, there tends to be more snow than average throughout the Northwest when La Niña is present. That study is for all of October–April; for a more season-by-season look, we can go to these composites, which reveal that, during past La Niñas, more than 60% of Dec–Feb and more than 70% of Jan–Mar have been snowier than average through the northwest, including Northern California.
Looking good so far, but...
Lots of rain so far where I am on the California central coast; even slightly below normal rain the rest of the season will be a blessing and possibly a dodged bullet.
Possibly! As Emily…
Possibly! As Emily documented earlier, the October-December La Nina average (the 3mo. season nearly completed) doesn't have a lot of drier than average conditions over California. (more wet than dry). It's really during the later winter and spring when the La Nina signal starts to emerge. See the January-March La Nina average, which has more of a tendency toward drier than average conditions over California. As always, official climate outlooks are probabilistic.
Rain in So. Cal.
So far its been pretty rainy in December for Southern California but it is supposed to be dry during La Nina. I recall a few years ago when La Nina was forecast the same thing happened and it was wetter than normal year. Im beginning to wonder if La Nina and El Nino really have anything to do with rainfall at all.
La Nina and California
It's true that California has been unusually rainy so far for a La Nina winter. Most La Nina winters have been dry in southern California, as Mike's latest Winter Outlook post clearly shows, but there have been exceptions, and perhaps this will be one of those exceptions (but we still have most of winter yet to come!). This is another case that clearly shows why seasonal forecasts are issued as probabilities - even if one particular outcome is favored (like a dry southern California), the influence of chaotic weather variability always has a chance to tip the scale in another direction. We certainly will look more closely at precipitation in California at the end of winter.
I also want to echo Michelle's response above, which notes that the La Nina dry signal in southern California is stronger in late winter than in early winter, so we will see if the second half is notably drier than the first half.
Wrong forecast
Our record December 2021 rainfall in Southern California is opposite to what this article says about typical La Nina. It says “reduced number of storms coming onshore along the southwestern U.S. coast and hence drier conditions”. I understand weather forecasts are difficult but we as scientists need to learn from our mistakes. Can the author explain why the predictions were so off this year?
La Nina and Southern California
I am sure that many forecasters and research scientists will do a more comprehensive post-mortem once winter is over, especially if these wet conditions continue, but I will just note a couple of points in two of the responses above.
First, as Michelle noted above, the La Nina signal for a dry southern California is stronger in late winter than in fall and early winter. From Emily's earlier post, the October-December La Nina precipitation composites do not show much of a dry signal over southern California, but the January-March average shows much drier conditions. So, we will be looking to see if drier conditions take hold in the second half of winter.
I also note that although most La Nina winters have been dry in southern California, Mike's latest Winter Outlook post clearly shows that there have been exceptions, and perhaps this will be one of those exceptions. This is another case that clearly shows why seasonal forecasts are issued as probabilities - even if one particular outcome is favored (like a dry southern California), the influence of chaotic weather variability always has a chance to tip the scale in another direction.
Perhaps this is not a fully satisfying answer, but we need both a full season for evaluation and time to perform a more thorough attribution.
La Nina and Grand Solar minimum
The Grand Solar minimum will make this a longer lasting La Nina than typical.
Three-peats every 22 years
Very correct Ron, I believe as seen in the decades of our yearly data, every other (odd numbered) solar cycle. Going back in the known record from 1950 through present, three-peats have already happened three times, and this current episode is the fourth. Every 22 years as the sun reverses a full cycle of N & S magnetic polarity. I like the old school terms of Grand Solar Minimum and perhaps Super La Niña.
Just my two considered, Indian cents.
#happynativeamericanheritagemonth
Three-peat La Niña
Very correct Ron, I think this three-peat is our fourth since the yearly 1950s records began. It seems to be in rhythm with these solar minima which occur every other 11yr solar cycle, as the sun flips magnetic poles from N to S. I like the term Grand Solar Minimum and perhaps Super La Niña three-peats.
That’s my two Indian cents.
#happynativeamericanheritagemonth.
Good Post
Very well written article, this is a best blog.
Very interesting!
Very interesting and informative blog post, keep up the good work!
Comments have been disabled on this article