Beyond the Data Blog
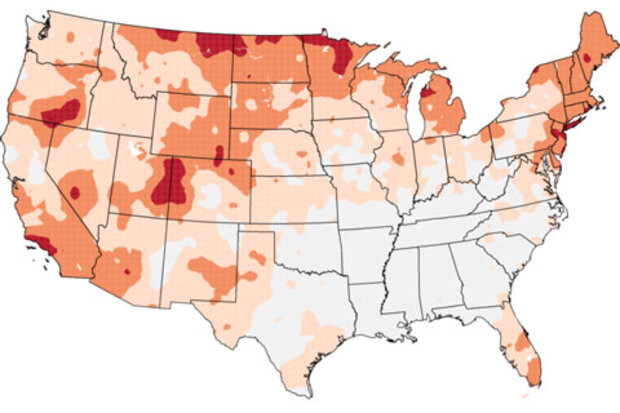
A few weeks ago, NCEI updated its U.S. climate trends maps with the data from 2018. Most months and places are getting warmer over time, especially over the very long (century scale) term.
But some regions and seasons are not changing in lock-step with the big picture. For January, considering all 124 years spanning 1895 through 2018, much of the South and Mid-South has cooled slightly. That regional/seasonal exception to the rule is a feature of and testament to the complexity of the climate system.
We’re going to look at January trends to tease out some nuances with how these trends are computed. Let’s go Beyond the Data.
Linear trends: the duct tape of statistics
…
Read article
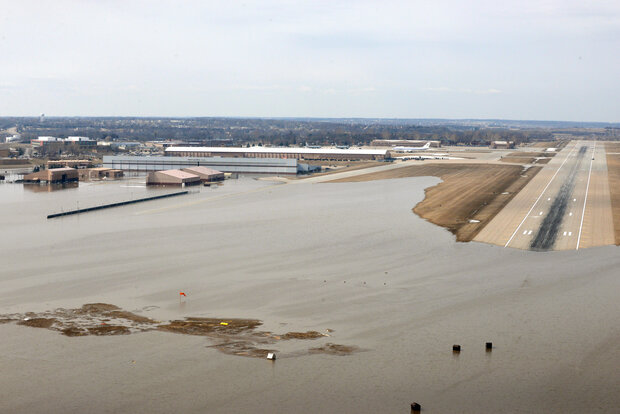
Borrowing one of meteorology’s great euphemisms, this spring has been “an active one” in much of the country. The Plains and Upper Midwest experienced huge events in back-to-back months. March brought an explosive winter storm to much of the region, and a cascade of events that led to historic flooding from Nebraska to Wisconsin. April gave us a more canonical blizzard, a winter storm with snowfall measured in feet.
So what happened? How does this fit into history? How does April bring the huge storms? Some answers follow. Let’s go Beyond the Data.
The March Cyclone and Floods
Understanding what happened in March requires going back several weeks in time to examine the condition…
Read article
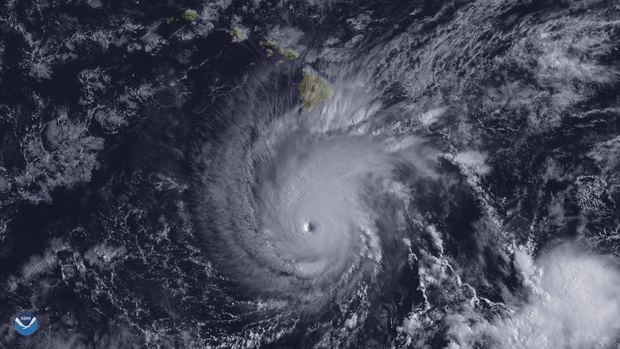
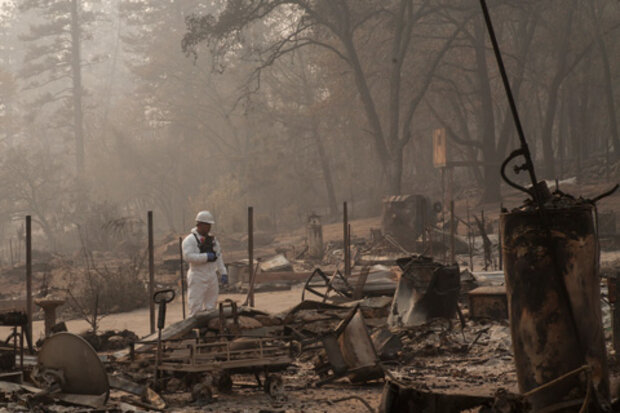
As Adam Smith wrote about in his recent billion-dollar disasters post, 2018 saw an unusual number of amazing—and deadly—weather events. Some had national coverage, especially Hurricanes Florence and Michael and their impacts on the eastern U.S., and the drought and heat triggering record fires in California and other parts of the western U.S.
Many networks across the U.S. collect air temperature and precipitation observations we use to characterize these events. As the nation’s official climate scorekeepers, scientists at NOAA’s National Centers for Environmental Information (NOAA NCEI) receive, quality control, store, and make these data accessible to the public.
Almost all of tho…
Read article
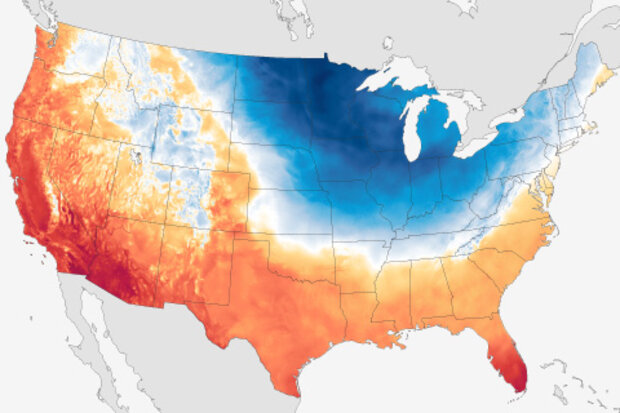
The record cold temperatures in the Midwestern United States in late-January led to over 20 fatalities and economic impacts likely to exceed $1 billion, according to one insurance industry estimate. Just how common are these cold records, and how do they compare to occurrences of warm records? What can these records tell us about climate change?
Fleeting—but record-setting—cold
One way we can answer these questions is to look at daily high and low temperature data from the Global Historical Climatology Network – Daily database. For this analysis, we only included stations from the Global Climate Observing System Surface Network that are at least 80% complete from 1951-present, resu…
Read article
NOAA’s National Centers for Environmental Information (NCEI) tracks U.S. weather and climate events that have great economic and societal impacts. Since 1980, the U.S. has sustained 241 weather and climate disasters where the overall damage costs reached or exceeded $1 billion (including adjustments based on the Consumer Price Index, as of January 2019). The cumulative cost for these 241 events exceeds $1.6 trillion.
During 2018, the U.S. experienced a very active year of weather and climate disasters. In total, the U.S. was impacted by 14 separate billion-dollar disaster events: two tropical cyclones, eight severe storms, two winter storms, drought, and wildfires. The past three yea…
Read article