Beyond the Data Blog
Daytime highs were in the negative teens in parts of the Upper Midwest and Great Lakes at the end of January, and the chill extended across much of the East. By the first week of February, temperatures in parts of the Mid-Atlantic and Southeast had plowed right past spring and into summer-like warmth. If the weather whiplash has left you wondering how U.S. winters are changing over time, the maps below tell the story. (Apologies Alaska, your statewide historical record doesn’t go far enough back to be included in these analyses).
The large map at left shows average temperature change during winter (December-February) from 1895-2017. The smaller column of maps at right shows indi…
Read article

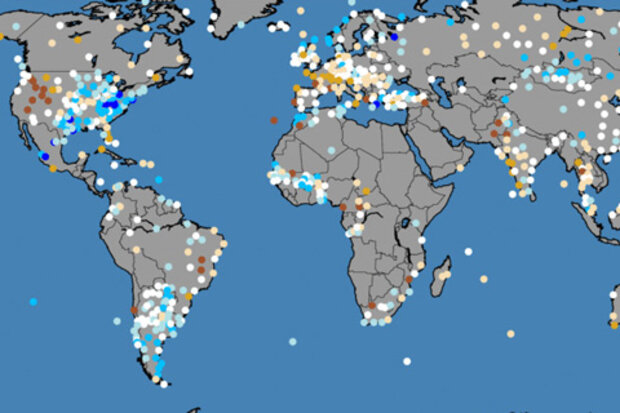
Most of us learned as children that the age of a tree could be found by counting its rings. Rings of trees growing in temperate climates can indeed tell their age through their annual rings and also help determine the age of wood used to construct buildings or wooden objects. The ages of wooden objects can be revealed by cross-dating, the process of matching ring patterns between wood samples of known and unknown ages.
What do tree rings tell us
The underlying patterns of wide or narrow rings record the year-to-year fluctuations in the growth of trees. The patterns, therefore, often contain a weather history at the location the tree grew, in addition to its age. In dry environments…
Read article
For about 20 years, the National Centers for Environmental Information (NCEI; formerly known as the National Climatic Data Center) has released a monthly Global Climate Report. The report can be described as Earth’s health assessment, where we as climatologists look into Earth’s "vitals" and place them into context by explaining what happened and how the recent vitals compare with older records. The current vital signs addressed in the report are temperature and precipitation.
Climatologists don’t make house calls, but we do provide answers about why keeping track of Earth’s vitals is so important. Here’s a quick Q&A.
Why is it important to have a monthly global climate report?…
Read article
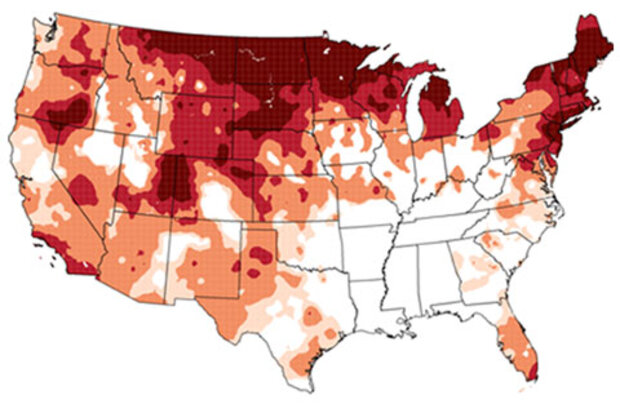
We live in a warming world. And we often characterize that warming through metrics of temperature. But that’s only a sliver of the story. Another sliver, and perhaps a more consequential one, of the story is the connected increase in atmospheric moisture.
Recent months have brought us—yet again—real-world examples of what these increases in moisture can bring.
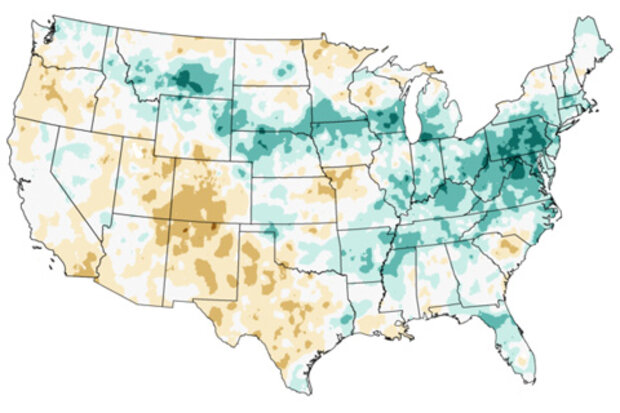
To say it’s been a wet year in the mid-Atlantic is an understatement. Through August, that is to say, before Florence, we were already working on the wettest year on record, or close to it, in much of the region.
Once Florence’s rains are factored into the end-of-September analyses, we’ll see much more dark green in the So…
Read article

* { margin: 0; padding: 0; }
#page-wrap { width: 620px; margin-left: 0px; position: relative; }
a { text-decoration: none; color: black; }
.image-link { display: block; width: 620px; height: 480px; position: absolute; top: -512px; left: 0px; }
#one { background: url(/sites/default/files/grid-ranks-tmax-201805-620px.gif) no-repeat; z-index: 3; }
#two { background: url(/sites/default/files/grid-ranks-prcp-201805-620px.gif) no-repeat; z-index: 2; }
#three { background: url(/sites/default/files/grid-ranks-tmin-201805-620px.gif) no-repeat; }
#one span { position: absolute; left: 0; bottom: -42px; text-align:center; font-family:"Trebuchet MS", Arial, Helvetica, sans-serif; }
#two span { …
Read article