2017 U.S. billion-dollar weather and climate disasters: a historic year in context
NOAA’s National Centers for Environmental Information (NCEI) tracks U.S. weather and climate events that have great economic and societal impacts (www.ncdc.noaa.gov/billions). Since 1980, the U.S. has sustained 219 weather and climate disasters where the overall damage costs reached or exceeded $1 billion (including adjustments based on the Consumer Price Index, as of December 2017). The cumulative costs for these 219 events exceed $1.5 trillion.
During 2017, the U.S. experienced a historic year of weather and climate disasters. In total, the U.S. was impacted by 16 separate billion-dollar disaster events including: three tropical cyclones, eight severe storms, two inland floods, a crop freeze, drought and wildfire.
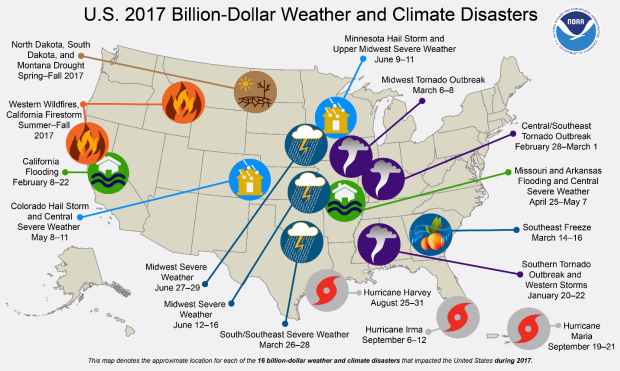
This map depicts the general location of the sixteen weather and climate disasters assessed to cause at least one billion dollars in direct damages during 2017.
2017 ties 2011 for the highest number of billion-dollar disasters for a single year. 2017 arguably has more events than 2011 given that our analysis traditionally counts all U.S. billion-dollar wildfires, as regional-scale, seasonal events, not as multiple isolated events. In 2017, the U.S. experienced several wildfire episodes that each exceeded $1 billion in losses in central and southern California (i.e., the Tubbs, Atlas and Thomas Fires). The only other year - again, since 1980 - in which the U.S. experienced multiple, separate billion-dollar wildfires was 2003: the Cedar and Old Fires, also in California.
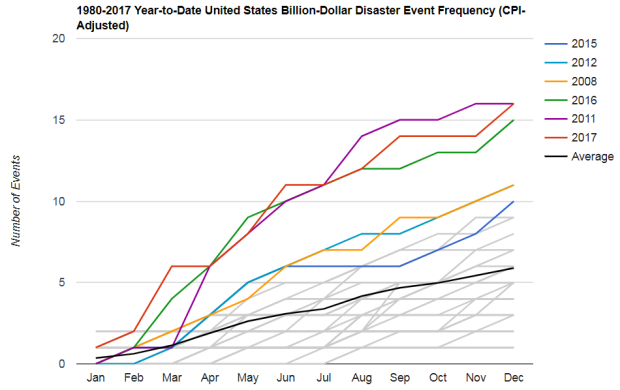
This graphic, sometimes called a "Haywood Plot" shows the month-by-month accumulation of billion dollar disasters for each year on record. The value for a given year for a given month shows the total number of billion-dollar events that had occurred by that month. Note that there is considerable overlap, and some years' traces are obscured.
Perhaps more notably than the high frequency of these events is the cumulative cost, which exceeds $300 billion in 2017 - a new U.S. annual record (Munich Re 2016; Swiss Re 2016; NOAA 2017). The cumulative damage of these events is $306.2 billion, which shattered the previous U.S. annual record cost of $214.8 billion (CPI-adjusted) in 2005 due to the impacts of Hurricanes Dennis, Katrina, Rita and Wilma. The damage from Hurricanes Harvey, Irma and Maria alone are responsible for approximately $265.0 billion of the $306.2 billion (NOAA 2017). Each of these destructive hurricanes now joins Katrina and Sandy, in the new top 5 costliest U.S. hurricanes on record.
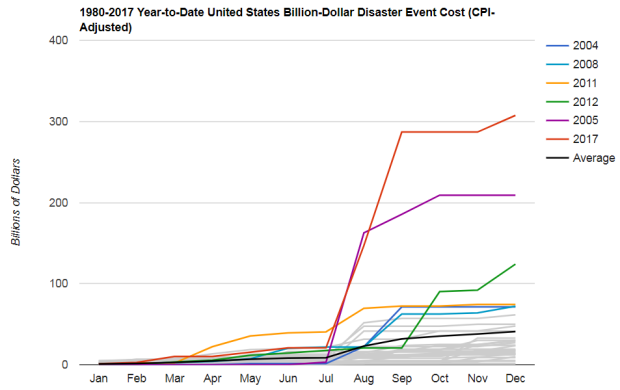
This graphic depicts the accumulation in the estimated cost of billion dollar weather and climate disasters on a monthly basis, for each year since 1980.
The Historic U.S. Billion-dollar Disasters of 2017
The following U.S. billion-dollar disaster events left an indelible impact among the disasters to affect to U.S. in 2017.
Hurricane Harvey:
In late-August, Hurricane Harvey caused unprecedented amounts of rainfall (up to 60 inches) over Houston one of America's largest cities. Harvey is the closest modern disaster comparison we have in relation to Katrina in terms of damage costs. Harvey’s costs exceed $125 billion, only second to Hurricane Katrina’s level of damage. Harvey was a category 4 hurricane making landfall near Rockport, Texas and causing widespread damage.
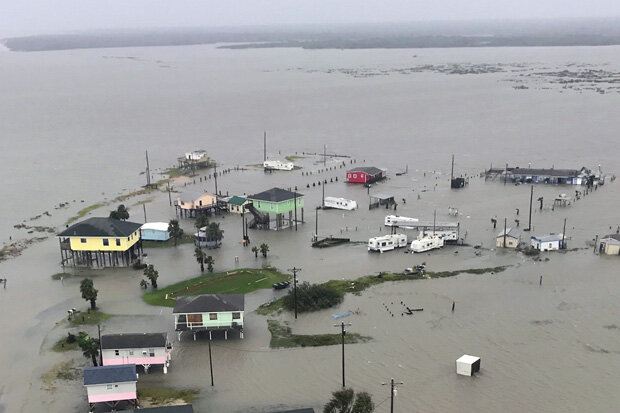
A flooded neighborhood on the Texas coast on August 27, 2017. Aerial photo by the Texas National Guard during aerial search and rescue mission in the Rockport, Holiday Beach, and Port Aransas area.
Harvey's devastation was most pronounced due to the large region of extreme rainfall producing historic flooding across Houston and surrounding areas. More than 30 inches of rainfall fell on 6.9 million people, while 1.25 million experienced over 45 inches and 11,000 had over 50 inches, based on 7-day rainfall totals ending August 31. This historic U.S. rainfall caused massive flooding that displaced over 30,000 people and damaged or destroyed over 200,000 homes and businesses. The costs for Harvey are approximately $125 billion, only second to Hurricane Katrina ($160 billion, after inflation adjustment to 2017 dollars).
Hurricane Irma:
In early September, Hurricane Irma devastated the Florida Keys with its high winds and storm surge, after flattening the U.S. Virgin Islands - St John and St Thomas - among other Caribbean islands. Irma was another category 4 hurricane when it made landfall at Cudjoe Key, Florida after devastating the U.S. Virgin Islands - St John and St Thomas - as a category 5 storm. The Florida Keys were heavily impacted, as 25% of buildings were destroyed while 65% were significantly damaged. Severe wind and storm surge damage also occurred along the coasts of Florida and South Carolina. Jacksonville, FL and Charleston, SC received near-historic levels of storm surge causing significant coastal flooding. Irma maintained a maximum sustained wind of 185 mph for 37 hours, the longest in the satellite era. Irma also was a category 5 storm for longer than all other Atlantic hurricanes except Ivan in 2004. The costs for Irma are approximately $50 billion, which excludes additional severe damage to non-US territories.
Hurricane Maria:
In mid-September, Hurricane Maria barreled through the southern Caribbean on a path toward Puerto Rico. Maria was comparable to Irma in its maximum wind damage, but also similar to Harvey in the feet of rain it dumped across Puerto Rico. Maria made landfall in southeastern Puerto Rico as a category 4 hurricane, after striking the U.S. Virgin Island of St. Croix. Maria's extreme winds caused widespread devastation to Puerto Rico's transportation, agriculture, communication and energy infrastructure. This damage was made more severe by the tremendous rainfall up to 37 inches, which caused widespread flooding and mudslides across the island. The interruption to commerce and standard living conditions will be the case for years, as much of Puerto Rico's infrastructure has to be entirely rebuilt. Maria tied Hurricane Wilma (2005) for the most rapid intensification, strengthening from tropical depression to a category 5 storm in 54 hours. Maria's landfall at Category 4 strength gives the U.S. a record three Category 4+ landfalls this year (Maria, Harvey, and Irma). The costs for Maria are approximately $90 billion.
Western Wildfires, California Firestorm:
In addition to the historic hurricanes, the U.S. had an extraordinarily damaging wildfire season burning more than 9.8 million acres. The cumulative costs approach $18 billion, which triples the previous U.S. annual wildfire season cost record of $6 billion (CPI-adjusted) that occurred in 1991. The historic U.S. wildfire season of 2017 began as numerous wildfires burned across many western and northwestern states. Montana in particular was affected by wildfires that burned in excess of 1 million acres. These wildfire conditions were enhanced by the preceding drought conditions. However, the height of the wildfire season occurred in October, as a historic firestorm damaged or destroyed over 15,000 homes, businesses and other structures across central California and caused 44 deaths.
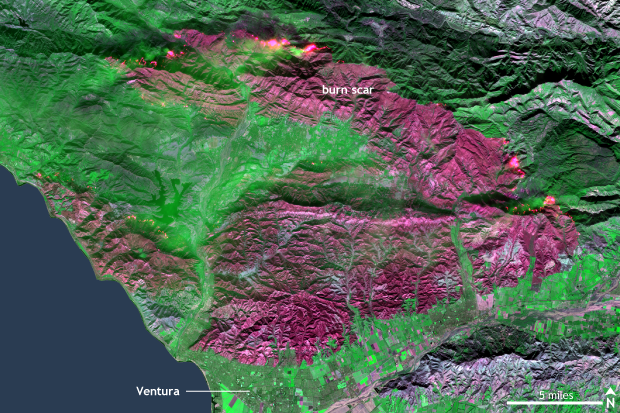
Image taken by the European Space Agencies (ESA) satellite, Sentinel 2 on December 8, 2017. This false color image shows the large burn scar left by the raging Thomas Fire near Ventura, California, north of Los Angeles. Ongoing fires can be seen along the edge of the burn scar in the northern part of the figure. NOAA Climate.gov image based on data from the ESA.
The combined destruction of the Tubbs, Atlas, Nuns and Redwood Valley wildfires represent the most costly U.S. wildfire event on record and the most deadly U.S. wildfire since the 1930s. Incredibly, another California firestorm developed in early December from persistent Santa Ana winds and extremely dry conditions. These wildfires burned over 1,000 homes and structures in southern California. The largest was Thomas fire that consumed over 285,000 acres making it the largest California wildfire on record. It is worth noting that none of the top 20 largest California wildfires have occurred after October, making the Thomas fire temporally unprecedented and a harbinger of longer western wildfire seasons.
Looking at the bigger picture
The years 2017 and 2016 each had a historically high number of billion-dollar disasters that impacted the U.S. (16 and 15 events, respectively). However, in 2017, the U.S. experienced a rare combination of high disaster frequency, disaster cost and diversity of weather and climate extreme events, as billion-dollar disasters occurred in 6 of the 7 disaster event categories we analyze. A winter storm with billion-dollar impacts was the only missing event type during 2017.
(bars) The number (left vertical axis), type (colors), and annual cost (right vertical axis) of U.S. billion-dollar disasters from 1980-2017. (lines) Running annual cost (purple line), along with the 95% confidence interval, and 5-year average costs (darkest purple line). The orange colors were chosen to emphasize the rising contribution of two event types to the total annual costs: severe storms and inland flooding. NOAA Climate.gov animation, based on NCEI data from Adam Smith.
Another similarity between 2017 and 2016 is the continuation of billion-dollar (non-tropical) inland flood events. During 2017, the U.S. experienced two billion-dollar inland flood events (i.e., California and Midwest regional flooding). In 2016, the U.S. experienced 4 billion-dollar inland flood events during 2016, doubling the previous annual record since our records began in 1980. The last two years continue the trend of multiple, billion-dollar inland flood event impacts, as have observed more frequently in the U.S. over the last decade. 2016 and 2017 also each had U.S. hurricane impacts exceeding $10 billion, as a reminder that hurricanes are historically the most damaging and costly weather events to affect the United States.
Distribution of costs and fatalities by disaster type
The distribution of damage from U.S. Billion-dollar disaster events from 1980 to 2017 (as of January 8, 2018) is dominated by tropical cyclone losses. Tropical cyclones have caused the most damage ($850.5 billion, CPI-adjusted) and also have the highest average event cost ($22.4 billion per event, CPI-adjusted). Hurricanes are responsible for slightly more than half (55.3%) of the total losses for all the U.S. billion-dollar disasters but represent less than one-fifth (17.4%) of all the billion-dollar events we have assessed since 1980. This total now includes the initial cost estimates for Hurricanes Harvey, Irma and Maria, which are continually being assessed and will be updated during our 4th quarter release. Drought ($236.6 billion, CPI-adjusted), severe storms ($206.1 billion, CPI-adjusted) and inland flooding ($119.9 billion, CPI-adjusted) have also caused considerable damage based on the list of billion-dollar events. Severe storms have caused the highest number of billion-dollar disaster events (91), while the average event cost is the lowest ($2.3 billion, CPI-adjusted). Tropical cyclones and flooding represent the second and third most frequent event types (38 and 28), respectively. Tropical cyclones are responsible for the highest number of deaths (3,461), followed by drought/heatwave events (2,993) and severe storms (1,578).
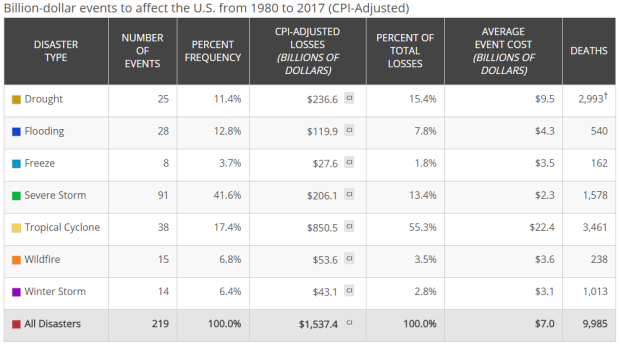
This table depicts the breakdown, by hazard type, of the 219 billion dollar weather and climate disasters assessed since 1980.
The rising frequency of billion-dollar disaster events
The U.S. has experienced a rising number of events that cause significant amounts of damage. From 1980–2016, the annual average number of billion-dollar events is 5.8 (CPI-adjusted). For the most recent 5 years (2013–2017), the annual average is 11.6 events (CPI-adjusted). 2017 ties 2011 for the highest number of billion-dollar disasters (16 events). The increase in population and material wealth over the last several decades are an important factor for the increased damage potential. These trends are further complicated by the fact that many population centers and infrastructure exist in vulnerable areas like coasts and river floodplains, while building codes are often insufficient in reducing damage from extreme events.
Climate change is also paying an increasing role in the increasing frequency of some types of extreme weather that lead to billion-dollar disasters. Most notably the rise in vulnerability to drought, lengthening wildfire seasons and the potential for extremely heavy rainfall and inland flooding events are most acutely related to the influence of climate change (NCA 2014).
The geography of billion-dollar disaster events by type
The U.S. is weather and climate conscious for good reason, as each geographic region faces a unique combination of persistent hazards. The maps below reflect the frequency with which each state has been part of a billion-dollar disaster event (i.e., the totals do not mean that each state alone suffered $1 billion in losses for each event).
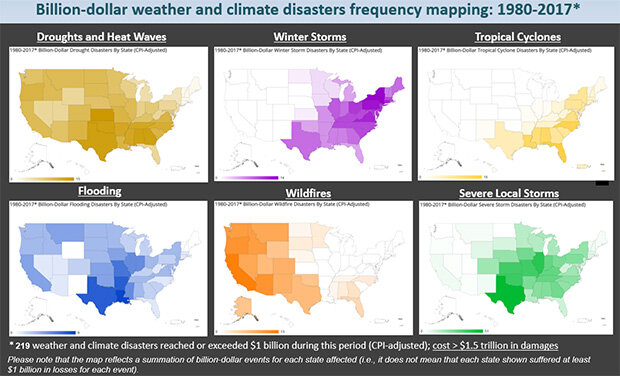
These maps depict the number of times each state has been affected by each of six types of billion dollar weather and climate disasters. Note that each state did not necessarily experience a full billion-dollar cost for an event to be counted; it only needed to be part of a regional event that caused one billion dollars or more in direct damages.
Each disaster type has a distinct footprint of impact over time. We see wildfire impacts largely west of the Plains states, including a few Southeast impacts. The high-frequency inland flooding events often occur in states adjacent to large rivers or the Gulf of Mexico, which is a warm source of moisture to fuel rainstorms. Drought impacts are most focused in the Southern and Plains states where there are billions of dollars in agriculture and livestock assets.
Crop freeze events have become more sporadic since the early 1990s, but these events can still cause considerable damage in the fruit-producing states of California, Florida and other Southeastern states such as Georgia and South Carolina. In 2017, the U.S. was impacted by its first billion-dollar crop freeze event since 2007. Severe freeze heavily damaged fruit crops across several southeastern states, as many crops were blooming 3+ weeks early due to unusually warm temperatures during the preceding weeks. Damage was most severe in Georgia and South Carolina.
Severe local storm events are common in the Plains and into the Ohio River Valley states. Winter storm impacts are concentrated in the Northeast, not surprising given the propensity for Nor’easters, while tropical cyclone impacts range from Texas to New England, but also include many inland states.
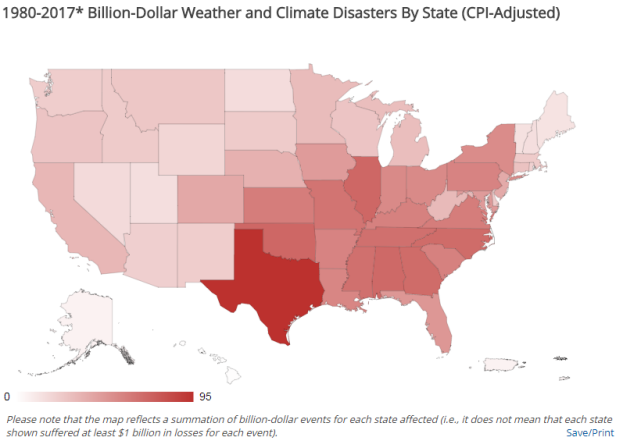
This map depicts the number of billion dollar weather and climate disasters affecting each state, since 1980, regardless of hazard type. Note that each disaster did not necessarily cause one billion dollars in damages in an individual state to be included in this total.
In total, from 1980–2017, the U.S. South/Central and Southeast regions experienced a higher frequency of billion-dollar disaster events than any other region, as shown in the red total disaster frequency map. The South region has also suffered the highest cumulative damage costs reflecting the cumulative diversity, frequency and severity of weather and climate events impacting these regions.

This map depicts the total estimated cost borne by each state, from billion dollar weather and climate events.
Comments
Storm Costs
RE: Storm Costs
RE: RE: Storm Costs
The scientist who does this annual analysis will have to weigh in on this for confirmation, but i am pretty sure that the analysis *does* include a running recalculation of costs so that all totals are always being expressed in "today's dollars." I encourage you to take a look at the methodology and details section of NCEI's webpage on this analysis: https://www.ncdc.noaa.gov/billions/
RE: RE: Storm Costs
RE: Storm Costs
Please note that I have edited your original response, which violated our comment policy in terms of civility, but I preserved the substance of your comment.
As Adam says in his post:
So, as you say, it would not be correct to use this analysis on its own as "proof" that human-caused climate change is affecting the frequency or cost of disasters. However, other research and assessments (like the National Climate Assessment) have demonstrated that certain kinds of extreme events are increasing in frequency or severity due to human-caused global warming. Given that those events are among the ones that are included in these analysis, it is also not correct to say that these events and their costs have "nothing to do with" human caused climate change.
RE: Storm Costs
RE: RE: Storm Costs
The annual billion dollar disasters analysis is adjusted for inflation, so that costs for all events over the period of record are always expressed in terms of today's dollars. The primary objective of these analyses is not to explain all the causes of extreme weather, which—as Adam says in the post—are numerous. The point is to provide a consistent way to compare the cost of weather and climate disasters over time, which is something that NOAA would be doing regardless of human-caused climate change.
RE: Storm Costs
Is this a surprise? The
RE: Is this a surprise? The
Well, whether it is a surprise depends on how you look at, I guess. On the one hand, as population grows and infrastructure expands to support that population, it's true that there are more assets exposed to damage from natural disasters. By that token, it isn't surprising that the cost of disasters has risen since NOAA started tracking it consistently in the 80s. But at the same time, it does surprise me a bit that with all our "progress"--the ability to better forecast certain disasters, better understanding of material science and construction techniques, the possibility of drone monitoring, etc--the US hasn't been able to translate that knowledge into a reduction in the costs associated with natural disasters.
Population is the biggest driver of damage costs
RE: Population is the biggest driver of damage costs
NOAA is the federal agency mandated by Congress to monitor, understand, and predict the weather and climate (among its many other obligations). It is mandated to share that information with the public to help protect the things that are valuable to us, including businesses, infrastructure, and natural resources.
This analysis of economically damaging extreme weather and climate events is not conducted for the purpose of climate change attribution. It is simply part of the agency's routine climate scorekeeping (they do it every month!). These monthly reports and annual summaries allows American citizens and businesses to compare one year to another and to put a given year's extreme weather and climate into a long-term perspective.
It is an analysis the agency would do even if there were no such thing as human-caused climate change.
Rules of engagement: Our comment policy
We are getting some comments on this post that are in violation of our comment policy, not because they are questioning or critical of the analysis, but because they are uncivil, use profanity, include attacks or insults directed at people and not at the science, etc. If you would like to be part of the discussion on this post, and your comment has not been posted, I encourage you to try again to express your questions or criticisms in a manner that makes it clear you are interested in starting a mutually respectful conversation with NOAA scientists and other readers of the Beyond the Data blog. You may always write to us at our webmail address, which can be found on our contact page.
Incomplete Analysis of Disaster Costs
RE: Incomplete Analysis of Disaster Costs
Actually, increasing population and material assets is the first point Adam mentions when he's discussing the rising costs shown in his analysis:
"Weather and climate" disasters/cost
RE: "Weather and climate" disasters/cost
There is really no universal definition of the time span at which "weather" becomes "climate. " Around the one-month mark, though, the definition of of a phenomenon as "weather" begins to fray a little. We all have an intuitive sense of what's "normal" temperature for the place we live in a given month, but not a given day of a month. In the case of the billion-dollar disaster analysis, there are some categories that are unequivocally weather (individual hurricanes, for example) and others that would stretch the definition of "weather" a little too far, such as droughts that can last for months or several seasons. In addition, the way the report has chosen to handle fires--as a seasonal and regional aggregate--is a little closer to the "climate" end of the continuum than the "weather" end.
Preparedness can reduce damage costs
citation for 1980-2017 table
RE: citation for 1980-2017 table
The complete (official) billion dollar disaster analysis appears at this URL:
https://www.ncdc.noaa.gov/billions/
Attribution to Climate Change
Question on Attribution To Climate Change
Weather Report
Apple and Oranges - what is the
RE: Apple and Oranges - what is the
This analysis provides a baseline of total, direct costs for many hazards and asset classes, beyond the value of real estate alone, which means we need a method of adjusting that can be applied consistently across all categories. However, anyone can apply their own choice of inflation-adjustment using the unadjusted data, which we also make available. There is indeed an increase over time in the number and value of assets exposed to the effects of extreme events. The changes documented in our analysis reflect a combination of increased exposure, vulnerability, and the impact of a variety of extreme events.
no. of deaths attributed to droughts
RE: no. of deaths attributed to droughts
Sorry I didn't see this comment sooner. I will flag it for the blog author.
Comments have been disabled on this article