2016: A historic year for billion-dollar weather and climate disasters in U.S.
NOAA’s National Centers for Environmental Information (NCEI) tracks U.S. weather and climate events that have great economic and societal impacts (www.ncdc.noaa.gov/billions). Since 1980, the U.S. has sustained 203 weather and climate disasters where the overall damage costs reached or exceeded $1 billion (including adjustments based on the Consumer Price Index, as of January 2017). The cumulative costs for these 203 events exceed $1.1 trillion.
The year 2016 was an unusual year, as there were 15 weather and climate events with losses exceeding $1 billion each across the United States. These events included drought, wildfire, 4 inland flood events, 8 severe storm events, and a tropical cyclone event (see map below). Cumulatively, these 15 events led to 138 fatalities and caused $46.0 billion in total, direct costs. The 2016 total was the 2nd highest annual number of U.S. billion-dollar disasters, behind the 16 events that occurred in 2011.
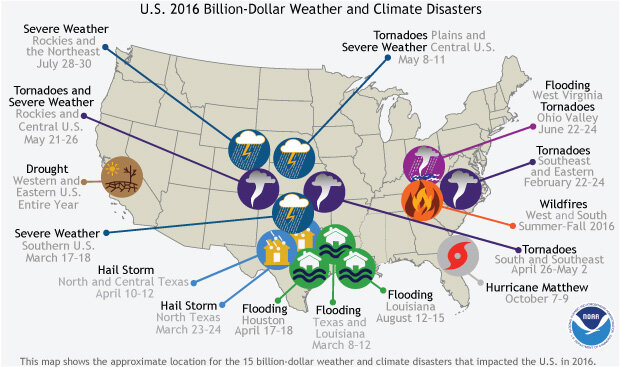
The location and type of the 15 weather and climate disasters in 2016 with losses exceeding $1 billion dollars. The majority of events occurred in the middle of the country from the Central Plains to Texas and Louisiana. Map by NOAA NCEI, adapted by Climate.gov.
Perhaps most surprising were the 4 separate billion-dollar inland flood (i.e., non-tropical) events during 2016, doubling the previous record, as no more than 2 billion-dollar inland flood events have occurred in a year since 1980. Three of these flood events were clustered in Louisiana and Texas between March and August, collectively causing damage approaching $15.0 billion. This is a notable record, further highlighted by the numerous other record flooding events that impacted the U.S. in 2016.
The changing frequency of billion-dollar disaster events
The U.S. has experienced a rising number of events that cause significant amounts of damage. From 1980–2016, the annual average number of billion-dollar events is 5.5 (CPI-adjusted). For the most recent 5 years (2012–2016), the annual average is 10.6 events (CPI-adjusted). The year 2005 was the most costly since 1980 due to the combined impacts of Katrina, Rita, Wilma, and Dennis, as shown in the following time-series. The year 2012 was the second most costly due to the extreme U.S. drought ($30 billion) and Sandy ($65 billion) driving the losses.
default caption.
The increase in population and material wealth over the last several decades are an important factor for the increased damage potential. These trends are further complicated by the fact that many population centers and infrastructure exist in vulnerable areas like coasts and river floodplains, while building codes are often insufficient in reducing damage from extreme events. Climate change is probably also paying a role in the increasing frequency of some types of extreme weather that lead to billion-dollar disasters.
In particular, the U.S. has experienced a higher frequency of billion-dollar inland (i.e., non-tropical) flood events in recent years. Perhaps this should not be unexpected, as heavy rainfall events and the ensuing flood risks are increasing due to the fact that warming loads the atmosphere with more water vapor (NCA, 2014). Over time, a wetter atmosphere increases the potential for extreme rainfall events, which we have experienced more of in recent years (e.g., Colorado, Texas, Louisiana, South Carolina, West Virginia).
Other types of extreme weather events have also shown a higher frequency including the semi-persistent Western drought and wildfire seasons since the year 2000. It has been observed that wildfire seasons are lengthening in the Western states and Alaska (NCA, 2014), while forestry management budgets are increasingly diverted for wildfire suppression costs (USFS, 2015).
In contrast, there have been fewer cold wave / crop-freeze events and destructive winter storm events, which were more frequent in the 1980s and 1990s. It is worth noting that in recent decades, the ratio of broken U.S. record high vs. record low temperatures has been dominated by new record highs, with far fewer record lows (NCAR, 2016; NCEI, 2017). However, trends in winter storm event intensity are subject to more uncertainty than only temperature.
Since 1980, landfalling tropical cyclones have been intermittent but are highly destructive. These impacts will only become more costly, as population and wealth continues to concentrate along our coasts, and sea level continues to rise. Severe local storm impacts (i.e., tornado, hail, straight-line winds) have risen in recent years but long-term trends in these events are subject to greater uncertainties (Tippet et al., 2016).
The frequency of disaster events by type
The distribution of damage from U.S. Billion-dollar disaster events across the 1980-2016 period of record (as of January 2017, CPI-adjusted) is dominated by tropical cyclone losses. The following table highlights that landfalling tropical cyclones have caused the most damage ($560.1 billion) and have the highest average event cost ($16.0 billion per event).
Drought ($223.8 billion), severe storms ($180.1 billion) and inland flooding ($110.7 billion) have also caused considerable damage based on the list of billion-dollar events. It is of note that severe storms are responsible for the highest number of billion-dollar disaster events (83) yet the average event cost is the lowest ($2.2 billion)— but still substantial. Tropical cyclones and flooding represent the second and third most frequent event types (35 and 26), respectively.
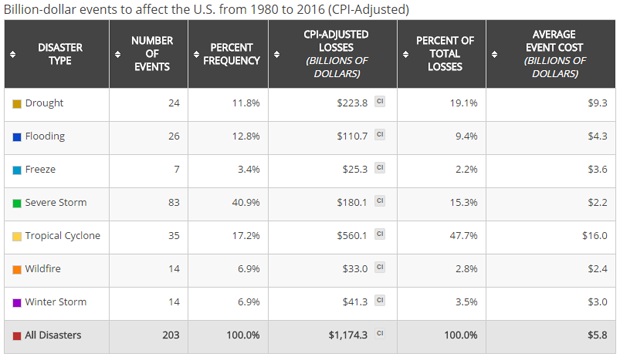
Table showing the number and costs associated with each type of billion-dollar disaster in the United States from 1980-2016. Tropical cyclones are not the most common disaster type, but they are the costliest. Billion-dollar severe storms have the lowest average cost per event, but they occur more than twice as often as the next most common event type. Summary stats table by Adam Smith, NOAA NCEI.
The spatial distribution of disaster events by type
The U.S. is weather and climate conscious for good reason, as each geographic region faces a unique combination of persistent hazards. The maps below reflect the frequency with which each state has been part of a billion-dollar disaster event (i.e., the totals do not mean that each state alone suffered $1 billion in losses for each event).
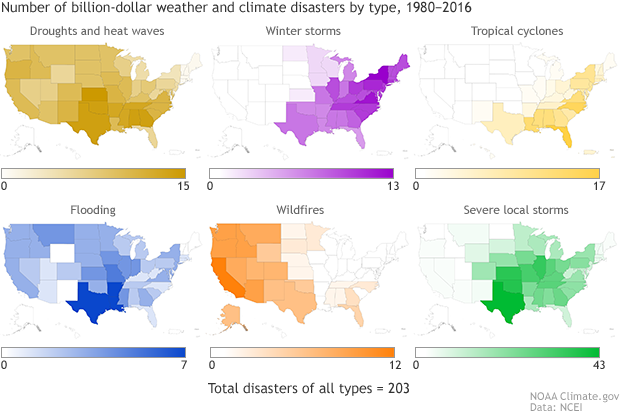
Each map shows the number of billion-dollar disasters affecting each U.S. state between 1980 and 2016. State totals mean that the state was part of that many billion-dollar disaster events, not that it alone experienced that many events. Image adapted by Climate.gov, based on NCEI originals by Adam Smith.
Each disaster type has a distinct footprint of impact over time. We see wildfire impacts largely west of the Plains states, including a few Southeast impacts. The high-frequency inland flooding events often occur in states adjacent to large rivers or the Gulf of Mexico, which is a warm source of moisture to fuel rainstorms. Drought impacts are most focused in the Southern and Plains states where there are billions of dollars in agriculture and livestock assets.
Severe local storm events are common in the Plains and into the Ohio River Valley states. Winter storm impacts are concentrated in the Northeast, not surprising given the propensity for Nor’easters, while tropical cyclone impacts range from Texas to New England, but also include many inland states.
In total, from 1980–2016, the U.S. South/Central and Southeast regions experienced a higher frequency of billion-dollar disaster events than any other region, as shown in the red total disaster map. This map reflects the cumulative diversity, frequency, & severity of weather & climate events impacting these regions.
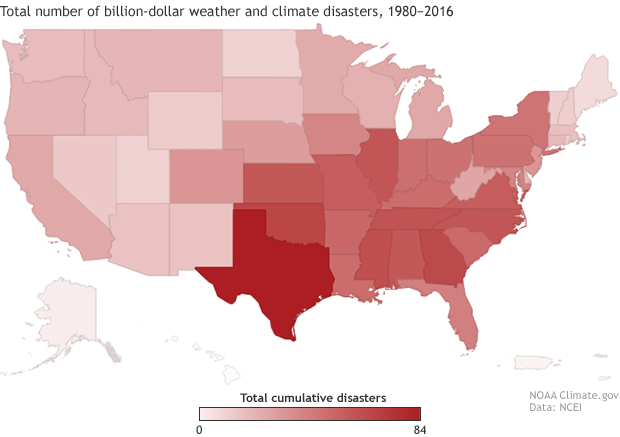
Map showing the number of times each state has been part of a billion-dollar weather or climate disaster of any type from 1980-2016. The darker the red, the greater the number of events the state has experienced. Map adapted by Climate.gov from original provided by NOAA NCEI.
More technical background on the methodology, data sources, and caveats
The U.S. Billion-dollar disaster reports assess the total, direct losses from numerous weather and climate disasters including: tropical cyclones, floods, drought & heat waves, severe local storms (i.e., tornado, hail, straight-line wind damage), wildfires, crop freeze events, and winter storms.
These loss estimates reflect direct effects of weather and climate events (i.e., not including indirect effects such as subsequent loss of tourism or missed work by employees) and constitute total losses (i.e., both insured and uninsured). The insured and uninsured direct loss components include: physical damage to residential, commercial and government/municipal buildings, material assets within a building, time element losses (i.e., businesses interruption), vehicles, boats, offshore energy platforms, public infrastructure (i.e., roads, bridges, buildings) and agricultural assets (i.e., crops, livestock, timber).
These loss assessments do not take into account losses to natural capital/assets, healthcare related losses, or values associated with loss of life. Only weather and climate disasters which cause losses of ≥ 1 billion-dollars in calculated damage including Consumer Price Index (CPI) inflation adjustment are included in this dataset. The following table provides an overview of the metadata behind the data sources used in the U.S. billion-dollar event analysis.
These natural disaster cost assessments require input from a variety of public and private data sources including the Insurance Services Office (ISO) Property Claim Services (PCS), Federal Emergency Management Agency (FEMA) National Flood Insurance Program (NFIP) and Presidential Disaster Declaration (PDD) assistance, and the United States Department of Agriculture (USDA) National Agricultural Statistics Service (NASS) & Risk Management Agency (RMA), among others.
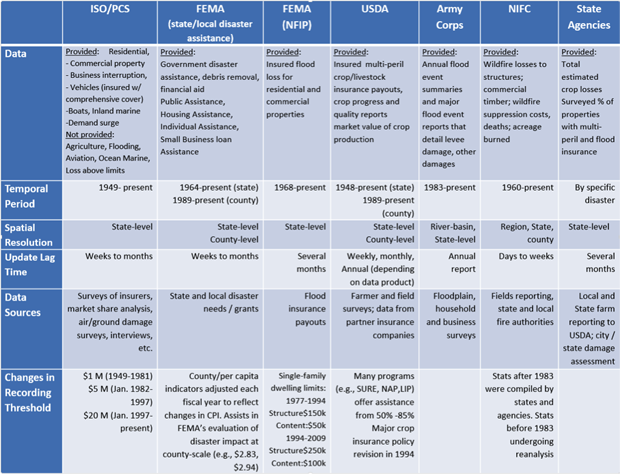
Table of inputs to the NOAA billion-dollar disaster analysis. Screen capture from the NCEI billion-dollar disaster interactive website.
Published research on report data sources, methodology, potential bias, and uncertainty modeling
Smith A.B. and J. Matthews, 2015: Quantifying Uncertainty and Variable Sensitivity within the U.S. Billion-dollar Weather and Climate Disaster Cost Estimates. Natural Hazards, 77, 1829-1851
http://www.ncdc.noaa.gov/billions/docs/smith-and-matthews-2015.pdf
Smith A.B. and R. Katz, 2013: U.S. Billion-dollar weather and climate disasters: Data sources, trends, accuracy and biases. Natural Hazards, 67, 387–410
http://www.ncdc.noaa.gov/billions/docs/smith-and-katz-2013.pdf
Additional cited references
NCA, 2014: http://nca2014.globalchange.gov/report
NCAR, 2016: https://www2.ucar.edu/atmosnews/news/124082/days-record-breaking-heat-ahead
NCEI, 2017: https://www.ncdc.noaa.gov/cdo-web/datatools/records
Tippet et al., 2016: http://science.sciencemag.org/content/early/2016/11/30/science.aah7393.full
U.S. Forest Service, 2015: https://www.fs.fed.us/about-agency/budget-performance/cost-fire-operations