2010-2019: A landmark decade of U.S. billion-dollar weather and climate disasters
NOAA’s National Centers for Environmental Information (NCEI) tracks U.S. weather and climate events that have great economic and societal impacts (www.ncdc.noaa.gov/billions). Since 1980, the U.S. has sustained 258* weather and climate disasters where the overall damage costs reached or exceeded $1 billion (including adjustments based on the Consumer Price Index, as of January 2020). The cumulative cost for these 258 events exceeds $1.75 trillion.
During 2019, the U.S. experienced a very active year of weather and climate disasters. In total, the U.S. was impacted by 14 separate billion-dollar disasters including: 3 major inland floods, 8 severe storms, 2 tropical cyclones (Dorian and Imelda), and 1 wildfire event. 2019 also marks the fifth consecutive year (2015-19) in which 10 or more separate billion-dollar disaster events have impacted the U.S.
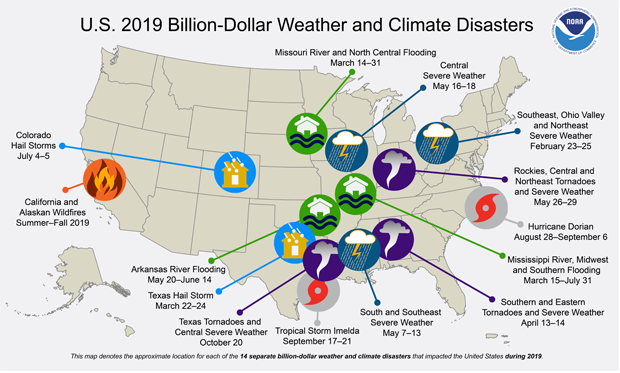
The general location of the 14 weather and climate disasters to have caused at least one billion dollars in direct damages during 2019. Map by NOAA NCEI.
Over the last several years costly disasters have been particularly destructive. The historic 2019 U.S. inland flooding across many Central states follows the historic 2018 and 2017 Atlantic hurricane and Western wildfire seasons, which set new damage cost records. These disasters have impacted dozens of Eastern, Central, and Western states, in addition to Caribbean territories (i.e., Puerto Rico and the U.S. Virgin Islands).
The number and cost of disasters are increasing over time due to a combination of increased exposure (i.e., values at risk of possible loss), vulnerability (i.e., how much damage does the intensity (wind speed, flood depth) at a location cause) and that climate change is increasing the frequency of some types of extremes that lead to billion-dollar disasters (NCA 2018, Chapter 2).
Number of events
The 14 separate U.S. billion-dollar disasters in 2019 represent the fourth highest total number of events (tied with 2018), following the years 2017 (16), 2011 (16) and 2016 (15). The most recent years of 2019, 2018 and 2017 have each produced more than a dozen billion-dollar disasters to impact the United States—totaling 44 events. This makes a 3-year average of 14.6 billion-dollar disaster events, well above the inflation-adjusted average of 6.5 events per year (1980-2019).
On a slightly longer timeframe, the U.S. has experienced 69 separate billion-dollar disaster events over the last 5 years (2015-2019), an inflation-adjusted average of 13.8 events per year. Over the last 40 years (1980-2019), the years with 10 or more separate billion-dollar disaster events include 1998, 2008, 2011-2012, and 2015-2019.
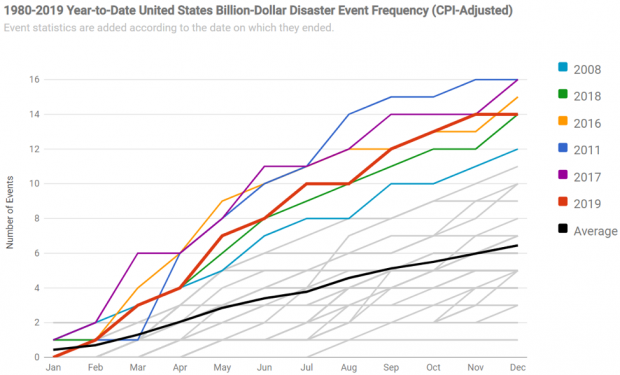
This graphic above shows the month-by-month accumulation of billion dollar disasters for each year on record. The value for a given year for a given month shows the total number of billion-dollar events that had occurred by that month in a given year. 2019 (thick red line) had the 4th highest total number of events (tied with 2018, green), following the years 2017 (purple), 2011 (dark blue) and 2016 (orange). Other years appear in gray. Note that there is considerable overlap, and some years' traces are obscured.
Cost comparisons
The year 2019 experienced a slightly above average year of costs ($45.0 billion), as noted below in the data plot by the black line. In 2019, the U.S. experienced historically persistent and destructive flooding across the Missouri, Arkansas, and Mississippi River basins. The combined cost of the Missouri, Arkansas, and Mississippi River flooding ($20.0 billion) was nearly half the total cost for all 14 of the billion-dollar disasters. The costliest U.S. disaster years on record are 2017 ($318.9 billion), 2005 ($226.1 billion), and 2012 ($130.9 billion) when all years are inflation-adjusted to January 2020 dollars. The 40-year annual cost average for billion-dollar disasters is $43.9 billion (CPI-adjusted), as noted by the black line in the following chart.
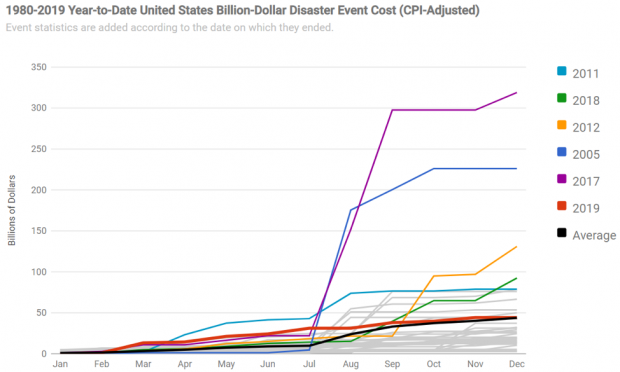
This graphic depicts the cumulative estimated cost of billion dollar weather and climate disasters on a monthly basis for each year since 1980. Driven by enormous losses from hurricanes, 2017 (purple line) and 2005 (dark blue line) stand head and shoulders above the rest of the pack in terms of total cost.
In broader context, the total cost of U.S. billion-dollar disasters over the last 5 years (2015-2019) exceeds $525 billion, with a 5-year annual cost average of $106.3 billion (CPI-adjusted), both of which are records. The U.S. billion-dollar disaster damage costs over the last decade (2010-2019) were also historically large, exceeding $800 billion from 119 separate billion-dollar events. Moreover, the losses over the most recent 15 years (2005-2019) are $1.16 trillion in damage from 156 separate billion-dollar disaster events.
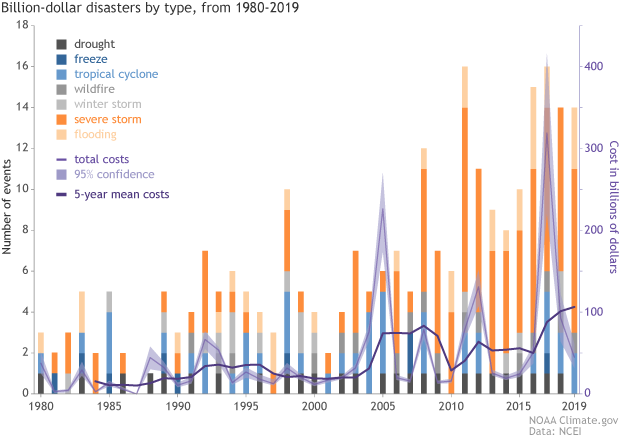
(bars) The number (left vertical axis), type (colors), and annual cost (right vertical axis) of U.S. billion-dollar disasters from 1980-2019. (lines) Running annual cost (purple line), along with the 95% confidence interval (purple shading), and 5-year average costs (black line).The bars are much taller in recent years, indicating that the number and costs of disasters are increasing. Inland flooding (light orange bars) and severe storms (orange bars) are making in increasingly large contribution to the number of U.S. billion-dollar disasters. NOAA Climate.gov image, based on NCEI data.
(As part of the release of the 2019 U.S. billion-dollar disaster report, the NCEI website offers interactive, state-level disaster frequency and cost charts for the last 40-years, 1980-2019. This includes all 50 states, Puerto Rico and the U.S. Virgin Islands. These new, high resolution charts can also be downloaded.)
2010-2019: an unprecedented decade of billion-dollar disasters
After adjusting for inflation, the U.S. experienced more than twice the number of billion-dollar disasters during the 2010s than the 2000s decade: 119 versus 59. Indeed, increased urbanization and material exposure to extreme event impacts is a large driver of the increasing losses, even after taking into account the rising cost of inflation, which we address.
|
|
Number of billion-dollar disasters (average per year) |
Associated Costs (average per year) |
Associated Fatalities (average per year) |
|
1980s (1980-89) |
28 (2.8) |
$127.7B ($12.8B) |
2,808 (281) |
|
1990s (1990-99) |
52 (5.2) |
$269.6B ($27.0B) |
2,173 (217) |
|
2000s (2000-09) |
59 (5.9) |
$510.3B ($51.0B) |
3,051 (305) |
|
2010s (2010-19) |
119 (11.9) |
$802.0B ($80.2B) |
5,212 (521) |
|
Last 5 years (2015-19) |
69 (13.8) |
$531.7B ($106.3B) |
3,862 (772) |
|
Last 3 years (2017-19) |
44 (14.7) |
$456.7B ($152.2B) |
3,569 (1,190) |
|
Overall (1980-2019) |
258 (6.5) |
$1.754.6B ($43.9B) |
13,249 (331) |
Four of the five most costly U.S. billion-dollar disasters occurred in the 2010s (i.e., Hurricanes Harvey, Irma, Maria, and Sandy). In addition, the two most destructive and costly wildfire seasons in U.S. history have taken place over the last three years, with losses exceeding $40 billion, with much of this damage in California.
Worrisome trends
Keep in mind that these estimates do not reflect the total cost of U.S. weather and climate disasters, only those associated with events in excess of $1 billion in damages. However, these extreme events do account for the majority (>80%) of the damage from all recorded U.S. weather and climate events (NCEI; Munich Re). These billion-dollar disaster events are becoming an increasingly larger percentage of the cumulative damage from the full distribution of weather-related events at all scales and loss levels.
Clearly, the historically large U.S. losses from hurricanes and wildfires over the last few years have further skewed the total distribution of extreme weather costs. This increase reflects a combination of increased exposure, vulnerability and the fact the climate change is playing an increasing role in the frequency of some types of extremes that lead to billion-dollar disasters.
- 1980-2000 …(~75% of full distribution of all disaster-related costs)
- 1980-2010 …(~80% of full distribution)
- 1980-2019 …(~85% of full distribution):
- $1.75 trillion of $2.05 trillion in US weather and climate events costs since 1980
Historic U.S. billion-dollar disasters of 2019
Among the many weather and climate-related disasters to affect the U.S. in 2019, the following caused the most damaging impacts and broke numerous records.
Missouri River and North Central Flooding (March 2019): $10.8 billion, 3 deaths
Historic Midwest flooding inundated millions of acres of agriculture, numerous cities and towns, and caused widespread damage to roads, bridges, levees, and dams. The states most affected were Nebraska, Iowa, Missouri, South Dakota, Minnesota, North Dakota, Wisconsin and Michigan. This flood was triggered by a powerful storm with heavy precipitation that intensified snow melt and flooding. Of note, the Offutt Air Force Base in Nebraska was also severely flooded—the third U.S. military base to be damaged by a billion-dollar disaster event over a 6-month period (Sept 2018-Feb 2019). This historic flooding was one of the costliest U.S. inland flooding events on record.
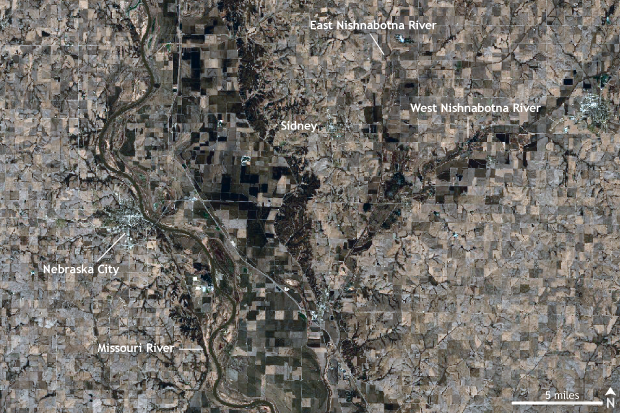
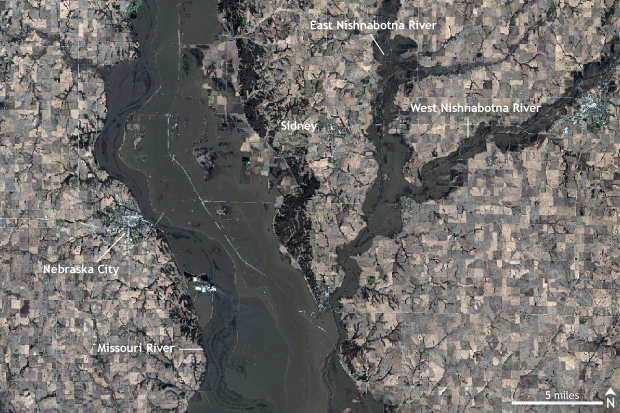
Grab and drag the slider to compare the March 2018 (left) and March 2019 (right) satellite images of the Missouri River near Nebraska City, Nebraska. A checkerboard of farmland in the center of the 2018 image is submerged by muddy flood waters in 2019 as rain and snowmelt swell the Missouri River to more than five miles across in places. Climate.gov images, based on Sentinel data from the European Space Agency.
Mississippi River and Midwest Flooding (March-July 2019): $6.2 billion, 4 deaths
Additional major flooding impacted many Southern Plains states through the spring and summer, significantly affecting agriculture, roads, bridges, levees, dams, and other assets across many cities and towns. The states most affected were Oklahoma, Nebraska, Missouri, Illinois, Kansas, Arkansas, Kentucky, Tennessee, Texas, Mississippi, and Louisiana. Very high water levels also disrupted barge traffic along the Mississippi River, which negatively impacted a variety of dependent industries. Indiana and Ohio were also affected by persistent heavy rainfall that flooded farmland, which prevented and reduced crop planting by millions of acres.
Hurricane Dorian (September 2019): $1.6 billion, 10 deaths
Category 1 Hurricane Dorian made landfall on the Outer Banks of North Carolina after devastating the northern Bahama Islands as a historically powerful and slow-moving hurricane. Dorian tracked offshore parallel to the Florida, Georgia, and South Carolina coastline before making a North Carolina landfall, bringing a destructive sound-side storm surge that inundated many coastal properties and isolated residents who did not evacuate. Significant flood, severe storm, and tornado damage to many homes and businesses occurred on the Outer Banks of North Carolina.
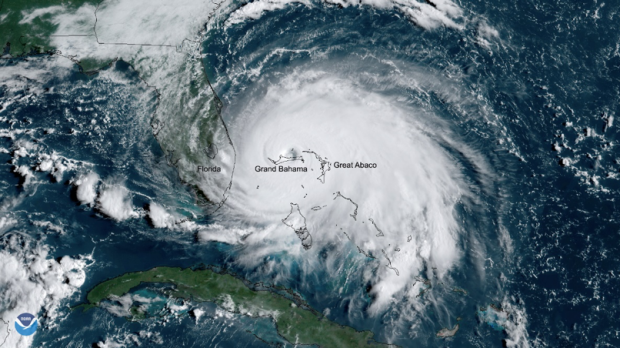
NOAA satellite image of Hurricane Dorian over the Bahamas in September 2019. NOAA Environmental Visualization Lab.
Dorian's intensification to a Category 5 storm marks the fourth consecutive year in which a Category 5 storm developed in the Atlantic basin—a new record. Dorian also tied the record for maximum sustained wind speed for a land-falling hurricane (185 mph) in the Atlantic, a record shared with the historic 1935 Labor Day Hurricane.
Tropical Storm Imelda (September 2019): $5.0 billion, 5 deaths
Tropical Storm Imelda and its remnants caused 24–36 inches of rain over a 3-day period across a large area between Houston and Beaumont, Texas. The largest storm total, 43.39 inches, was reported at North Fork Taylors Bayou, Texas. Many thousands of homes, cars, and businesses were impacted by flood water due to this extraordinarily heavy rainfall. Imelda is yet another of the historically extreme rainfall and flood events that have become a regular occurrence across Southeast Texas over the last 5 years.
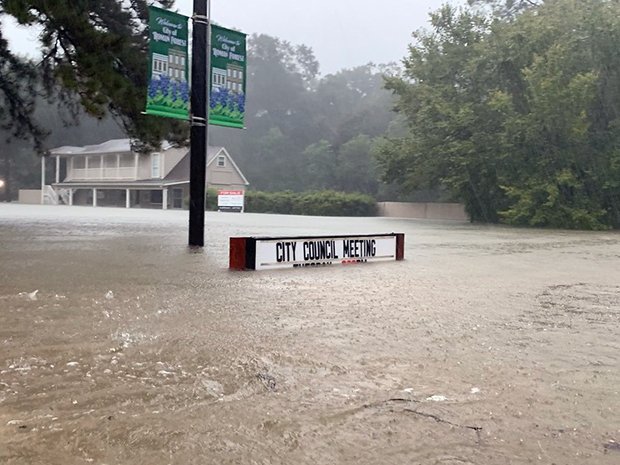
Flooding in Roman Forest, Texas, on Sep 19, 2019 from Tropical Storm Imelda. Photo by Jill Carlson, used under Creative Commons license.
California and Alaska Wildfires (Summer-Fall 2019): $4.5 billion, 3 deaths
California experienced a damaging wildfire season in 2019, largely resulting from the Kincade and Saddle Ridge wildfires. In addition, a key California electrical utility provider turned off power to millions of homes and businesses several times during days with forecasted high winds and extremely dry conditions. This step was designed to minimize wildfires, with some success, but it also caused billions of dollars in losses to those affected. Alaska also suffered a near-historic wildfire season with more than 2.5 million acres burned. These wildfire conditions were primed due to Alaska's record-breaking heat and dry conditions during the summer months. July 2019 was the warmest month ever recorded in Alaska.
The remains of Soda Rock Winery, Jimtown, California, on November 2, 2019, after the Kincade Fire. Photo by Mark Gunn, used under a Creative Commons license.
Distribution of costs and fatalities by disaster type
The distribution of damage from U.S. billion-dollar disaster events from 1980–2019 is dominated by tropical cyclone losses. Tropical cyclones have caused the most damage ($945.9 billion) and also have the highest average event cost ($21.5 billion per event). Hurricanes are responsible for slightly more than half (53.9%) of the total losses for all U.S. billion-dollar disasters but represent less than one-fifth (17.1%) of all the billion-dollar events we have assessed since 1980.
Drought ($249.7 billion), severe storms ($247.8 billion) and inland flooding ($146.5 billion,) have also caused considerable damage. Severe storms have caused the highest number of billion-dollar disaster events (113), while the average event cost is the lowest ($2.2 billion). Tropical cyclones and flooding represent the second and third most frequent event types (44 and 32), respectively. Tropical cyclones are responsible for the highest number of deaths (6,502), followed by drought/heatwave events (2,993), and severe storms (1,642).

This table shows the breakdown, by hazard type, of the 258 billion-dollar weather and climate disasters assessed since 1980. Screenshot from NOAA NCEI Billion-dollar Disasters webpage.
The increase in population and material wealth over the last several decades, are an important cause for the rising costs. These trends are further complicated by the fact that much of the growth has taken place in vulnerable areas like coasts and river floodplains. Vulnerability is especially high where building codes are insufficient for reducing damage from extreme events.
Climate change is also paying a role in the increasing frequency of some types of extreme weather that lead to billion-dollar disasters—most notably the rise in vulnerability to drought, lengthening wildfire seasons in the Western states, and the potential for extremely heavy rainfall becoming more common in the eastern states. Each of these changes in extremes are becoming more visible in relation to the influence of climate change (NCA 2018, Chapter 2).
The geography of billion-dollar disaster events by type
The U.S. is weather and climate conscious for good reason, as each geographic region faces a unique combination of recurring hazards. In fact, billion-dollar disaster events have touched every U.S. state. The maps below reflect the frequency with which each state has been part of a billion-dollar disaster event (i.e., the totals do not mean that each state alone suffered $1 billion in losses for each event).
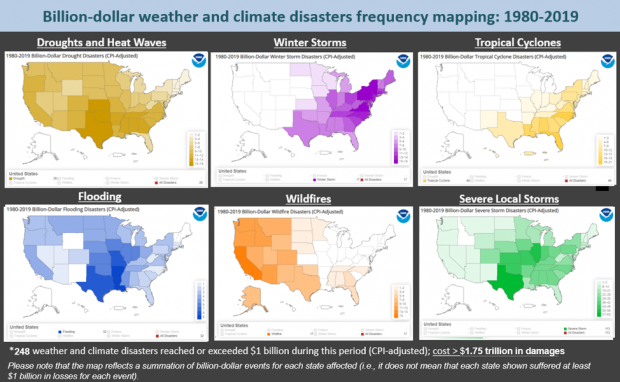
These maps show the number of times each state has been affected by each of six types of billion-dollar weather and climate disasters from 1980-2019. Note that each state did not necessarily experience the full billion-dollar cost for an event to be counted; it only needed to be part of a regional event that caused one billion dollars or more in direct damages. Screenshots from NOAA NCEI Billion-dollar Disasters webpage.
Each disaster type has a distinct footprint of impact over time. We see wildfire impacts largely west of the Plains states, with a few Southeast impacts. However, the most intense and destructive wildfires occur in California–most notably after the year 2000.
There is also a high frequency of inland flooding events that occur in states adjacent to large rivers or the Gulf of Mexico, which is a warm source of moisture to fuel rainstorms. Drought impacts are mostly focused in the Southern and Plains states where there are billions of dollars in agriculture and livestock assets.
Crop freeze events have become more sporadic since the early 1990s, but these events can still cause considerable damage in the fruit-producing states of California, Florida, and other southeastern states such as Georgia and South Carolina.
Severe local storm events are common in the Plains and into the Ohio River Valley states. Winter storm impacts are concentrated in the Northeast given the population density and more assets exposed to powerful Nor’easters bringing wind, snow, icing and storm surge. Tropical cyclones are the most costly disaster we assess that create impacts from Texas to New England, but also include many inland states, often as a result of extreme rainfall and inland flood damage.
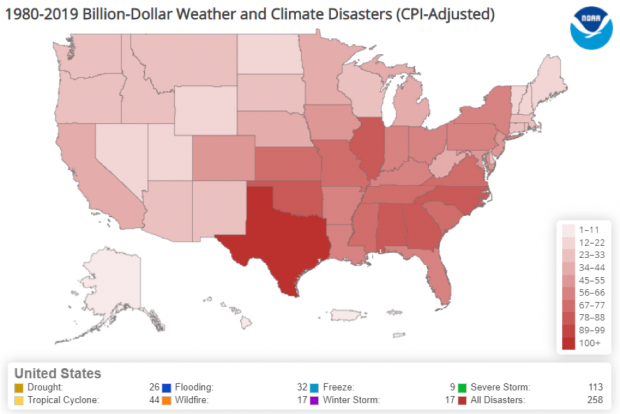
This map depicts the number of times each state was part of a billion-dollar weather or climate disaster since 1980, regardless of hazard type. Note that each disaster did not necessarily cause one billion dollars in damages in an individual state to be included in this total. Screenshot from NOAA NCEI Billion-dollar Disasters webpage.
In total, from 1980–2019, the U.S. South/Central and Southeast regions experienced a higher frequency of billion-dollar disaster events than any other regions, as shown in the red total disaster frequency map. The South has also suffered the highest cumulative damage costs, reflecting the diversity, frequency, and severity of weather and climate events impacting the region.
Each state has been affected by at least 1 billion-dollar disaster since 1980. Texas has experienced the highest number of events (111) and is one of the few states that have been impacted by all seven types of the billion-dollar disasters we analyze.
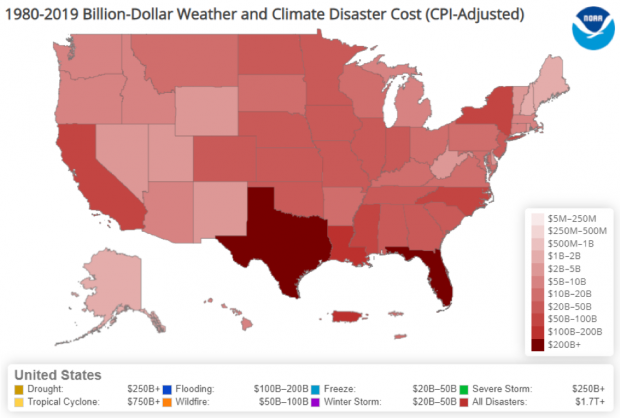
This map of U.S. states and Puerto Rico shows total estimated costs borne by each state from billion-dollar weather and climate disasters from 1980-2019. Screenshot from NOAA NCEI Billion-dollar Disasters webpage.
Adjusted for inflation, the South/Central and Southeast regions of the U.S., including the Caribbean U.S. territories, have suffered the highest cumulative damage costs, reflecting the severity and widespread vulnerability of those regions to a variety of weather and climate events. In addition to the highest number of billion-dollar disasters experienced, Texas also leads the U.S. in total cumulative costs (~$250 billion) from billion-dollar disasters since 1980. Florida is the second-leading state in total costs since 1980 (~$225 billion), largely the result of destructive hurricane impacts.
Yet, another way to examine damage is to compare each state’s annual disaster losses relative to their Gross State Product (GSP), which represents economic output. In 2019, the Midwest states suffered extensive losses from the worst flooding since 1993.
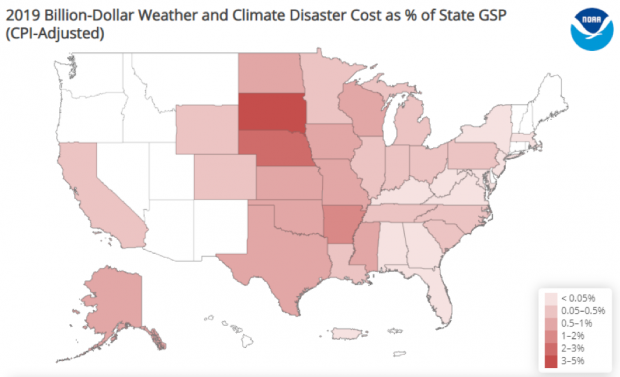
A map of U.S. states shows the costs of billion-dollar disasters in 2019 as a percent of each state's gross state product. Darkest reds show states with highest percent damages, which are found in South Dakota and Nebraska, which suffered from significant flooding in spring and summer 2019. Screenshot from NOAA NCEI Billion-dollar Disaster webpage.
All of the tables and maps shown in this article are screenshots from NCEI’s interactive Billion-dollar Disasters webpage. Visit the page to create your own summaries or download source data. In 2020, NCEI will continue to incorporate new layers and filters that offer added flexibility to the online tools for additional context and analysis. For additional context on data sources, methods, metrics and caveats see: Calculating the Cost of Weather and Climate Disasters.
* Editor's note [January 10, 2019]. Due to a typo, an earlier version of this article cited the number of events as 248. The correct number is 258.
Comments
Rest in peace to everyone who
Billion $ disasters
RE: Billion $ disasters
RE: Billion $ disasters
I'm posting a response from blog author Adam Smith, which he sent via email. He echoes Deke's comment:
Shouldn't the losses also be
RE: Shouldn't the losses also be
yes, as Adam said in the early part of the post...
Depending on what you want to do with the data, you would likely have to make additional adjustments. If you wanted to be able to say exactly how much each factor contributed, then you'd definitely have to account for the greater development intensity today compared to earlier decades. But that kind of attribution is beyond the scope of the analysis. The annual billion-dollar disaster update is simply an inflation-adjusted score-card that can be used to compare total costs from one year to another.
Other factors
RE: Other factors
yes, that's definitely part of it. As Adam wrote:
As far as I know, no one has done a more detailed attribution analysis--trying to determine how much each factor (exposure, vulnerability, and disaster frequency/intensity) has contributed to the observed increases in billion-dollar disaster events. But if they did, they would have to account for all those variables you mentioned, and more!
Annual CPI Adjusted Costs
RE: Annual CPI Adjusted Costs
Those data are shown in the fourth graphic of the post. The underlying data are available here: https://www.ncdc.noaa.gov/billions/time-series
Disaster Response
RE: Disaster Response
What do you mean by "response"?
Cost
RE: Cost
The blog author, Adam Smith, had this response:
Cost Data
RE: Cost Data
https://www.ncdc.noaa.gov/billions/time-series
The download link appears under the main graph.
State data available?
RE: State data available?
The Billion-dollar disaster section of the NCEI website has lots of options for sorting and filtering data. Start here:
https://www.ncdc.noaa.gov/billions/overview
Use the blue tabs across the top of the page to access the maps. Also, each of these tabs offers an option to sort by region or state: time series, Climatology, Summary stats, and events.
Total weather costs
I don't understand the focus on billion dollar events.
I one year has numerous 900 million dollar events it could significantly affect that years total damage.
From 1950 too 2021 what is the annual CPI adjusted total weather related costs?
That is the number that informs how much investment should go to climate mitigation
Re: total weather costs
Our blogger had this response:
Even though $1 billion is an arbitrary threshold, these specific events account for the majority (>80%) of the damage from all recorded U.S. weather and climate events (NCEI; Munich Re). In fact, these billion-dollar disaster events are becoming an increasingly larger percentage of the cumulative damage from the full distribution of weather-related events at all scales and loss levels.
We do have lots of data to analyze smaller events, but details are not always available or consistent on smaller events. Larger disasters are more likely to have complete info. 1980 is the beginning of the first decade in which most of the public and private sector disaster data resources we use become available.
For context, the 42-year (1980-2021) annual average cost for these billion-dollar disasters (inflation-adjusted to 2021 dollars) is $51.4 billion. However, the total cost of U.S. billion-dollar disasters over the last 5 years (2017-2021) is $742.1 billion, with a 5-year annual cost average of $148.4 billion, both of which are new records and nearly triple the 42-year inflation adjusted annual average cost.
Also, we do introduce events into the time series as they "inflate" their way above $1B in costs in today's dollars. Every year, this leads to the introduction of several new events added from earlier in the time series.
Starting point
How dependent are your results and conclusions on the starting point? I you go back to 1900 and have to include the Galveston hurricane, the hurricanes of the 1930s and 1960s, the Dust Bowl of the 1930s and the floods of the 1930s, won't you end up showing that over the last 12 decades, there has actually been an appreciable decrease in the frequency and severity of weather events, wildfires, floods, and dust storms?.
Comments have been disabled on this article