October 2018 ENSO update: Trick or treat!
ENSO-neutral conditions still reign as of the beginning of the month, but we’re starting to see some clearer signs of the development of El Niño. Forecasters estimate that El Niño conditions will develop in the next few months, and there’s a 70-75% chance El Niño will be present through the winter. Most computer models are currently predicting a weak El Niño event.
Goblins and ghouls
Over the past several weeks, surface temperature anomalies (difference from the long-term average) have gradually increased across much of the tropical Pacific. All four of the Niño-monitoring-region temperatures are now above average.
Animation showing sea surface temperature departure from the long-term average from late August through early October 2018. Graphic by climate.gov; data from NOAA’s Environmental Visualization Lab.
The temperature in the Niño3.4 region (our primary metric for monitoring El Niño’s development) was 0.7°C above the long-term average in the latest weekly measurement. Yep, that’s above the El Niño threshold of 0.5°C, but we’ll need the monthly temperature in the Nino3.4 region to average above that threshold, plus an expectation that it will stay above, and indications that the atmosphere is responding to the change in the ocean before we’d declare El Niño.
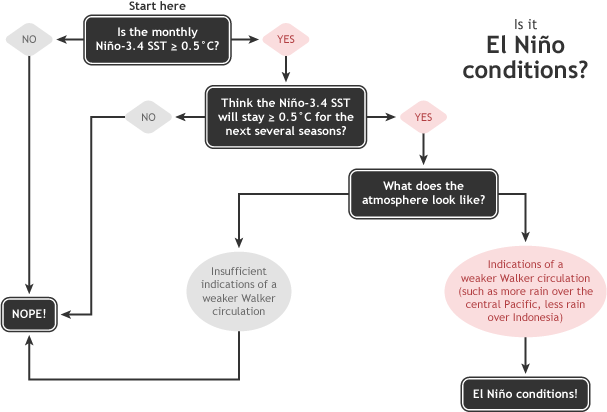
Summary of NOAA decision process in determining El Niño conditions. NOAA Climate.gov drawing by Glen Becker and Fiona Martin.
Witches and wizards
Regular ENSO Blog readers will know that we go on about the winds that blow across the tropical Pacific. At times, we probably get pretty windy about the wind! That’s because these winds are very important to the development and maintenance of El Niño and La Niña. ENSO—short for El Niño-Southern Oscillation—is a coupled system, meaning the ocean causes changes in the atmosphere and the atmosphere in turn affects the ocean.
The trade winds normally blow from east to west (“easterly” winds, in meteorological parlance) along the equator in the Pacific. They help bring colder water up from the depths of the ocean to the surface near South America and also pile up warmer waters in the far western Pacific, near Indonesia. When these winds slow down, the surface water can warm, and warmer waters from Indonesia begin to slosh eastward (a downwelling Kelvin wave). It takes a few months for the warm blob of water to travel across the Pacific, and when it reaches the coast of South America, the blob can rise to the surface, providing a months-long source of warmer water to the surface.
The reason I’m rattling on about this effect of the winds is that we’ve recently had a pretty substantial slowing down of the trade winds in the central and eastern Pacific—one of the strongest such episodes during September/October since 1979, when our real-time reanalysis data records begin.
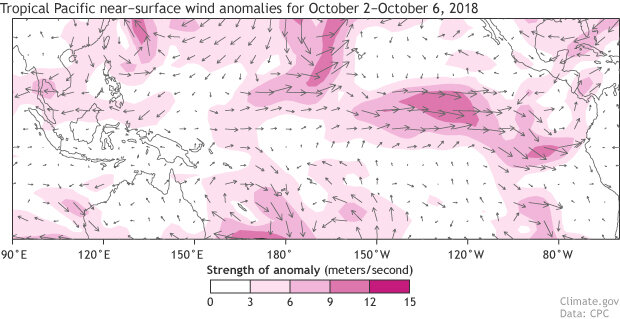
Wind anomalies (departure from the long-term average) during early October, 2018. Shading shows the strength of the anomaly; arrows indicate the direction of the anomaly.
This slowdown in the winds has already allowed the surface to warm, and will help to reinforce the warmer subsurface waters that have been developing since August. The temperature anomaly in the upper ~1000 feet of the central-eastern Pacific, elevated since the spring, has increased over the past month.
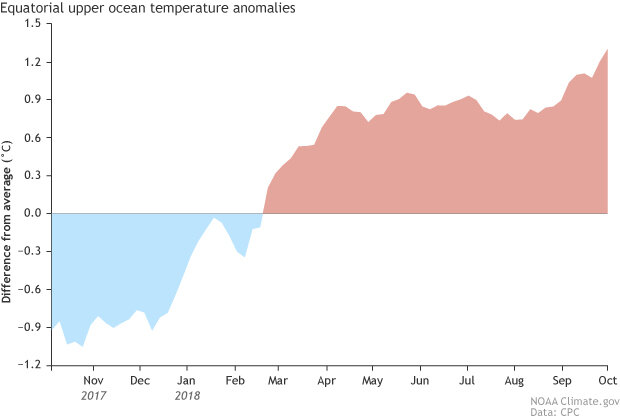
Area-averaged upper-ocean heat content anomaly (°C) in the equatorial Pacific (5°N-5°S, 180º-100ºW). The heat content anomaly is computed as the departure from the 1981-2010 base period pentad (5-day) means. Climate.gov figure from CPC data.
Elsa and Anna
The development of El Niño in the late fall isn’t unusual, with nine El Niño events since 1950 starting in August–October or later in the fall. Of these, only one (1986-87) had a peak Niño3.4 Index greater than 1.0 degree; all the others were weaker events. Since El Niño events peak in November or December, there probably isn’t enough time for sea surface temperature anomalies to grow very large.
The strength of El Niño doesn’t necessarily indicate the strength of its impacts on global weather. But a stronger El Niño can increase the likelihood that impacts of some kind will happen. The Climate Prediction Center’s winter outlook will be released next Thursday (October 18th), so stay tuned to see what effect El Niño may have on U.S. winter weather. We’ll also have a post here at the ENSO Blog on that outlook.
Comments
MODIKI
RE: MODIKI
ENSO events are so different that we generally discourage using 'analogs' to say something about the future. We wrote a little bit about this here: https://www.climate.gov/news-features/blogs/enso/why-past-enso-cases-aren’t-key-predicting-current-case This case-to-case variance is why our climate outlooks (e.g. winter outlook 2018-19) are expressed in probabilities.
Interesting
RE: Interesting
average temperature
RE: average temperature
Our official index that tracks ENSO does use a de-trending process in an attempt to remove long-term trends.
http://origin.cpc.ncep.noaa.gov/products/analysis_monitoring/ensostuff/ONI_v5.php
More detailed description here:
http://origin.cpc.ncep.noaa.gov/products/analysis_monitoring/ensostuff/ONI_change.shtml
Late Niños with ONI >1 in at least two cases
Why no Africa?
RE: Why no Africa?
These global ENSO maps of temperature and precipitation departures may be helpful to you:
http://www.cpc.ncep.noaa.gov/products/precip/CWlink/ENSO/regressions/
Climate Prediction Center’s winter outlook October 18th
https://www.climate.gov/news
https://www.climate.gov/news-features/blogs/enso/another-mild-winter-noaa’s-2018-19-winter-outlook
and here for the official products (these update once every month):
http://www.cpc.ncep.noaa.gov/products/predictions/long_range/
Heavy Rains
Gulf of Alaska temperature anomalies
Comments have been disabled on this article