November 2016 La Niña update: Hello, lady!
Let’s take a tour through the La Niña diagnostic flowchart…
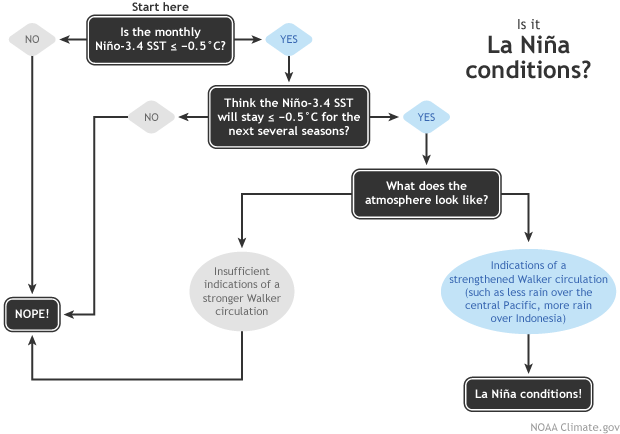
Flowchart showing decision process for determining La Niña conditions. Figure by Fiona Martin, adapted by Climate.gov.
Is the sea surface temperature in the Niño3.4 region more than half a degree cooler than average? Yes! (It was about -0.7°C below average during October.) Do forecasters think it will stay cooler than that threshold for several overlapping three-month periods? Yes! (But just barely.) Finally, are there signs that the atmospheric circulation above the tropical Pacific is stronger than average? Yes! This all means that La Niña has officially arrived.
First things first
The Niño3.4 Index—the temperature of the ocean surface in a specific region of the equatorial Pacific, and our primary metric for measuring El Niño and La Niña—has been trending cooler since the demise of our big El Niño event in May. We now have two consecutive overlapping “seasons” (in climate forecaster lingo, that’s any three-month period) where the Nino3.4 Index averaged more than -0.5°C cooler than the long-term average: July—September and August—October.
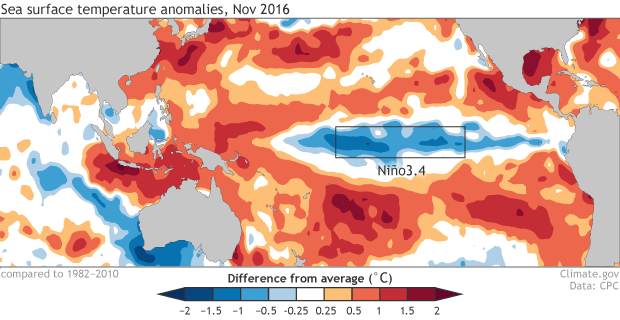
Average sea surface temperature during October 2016, compared to the 1981-2010 average. Climate.gov figure, from CPC data.
One of the interesting things about this sea surface temperature map is just how warm the rest of the world’s oceans are, even compared to recent La Niña years like October 2011 or October 2007. Visit NOAA’s Visualization Lab to look at earlier years. (But be warned—there’s a lot of fun stuff to look at over there!)
Next step
The current NOAA Climate Prediction Center/IRI forecast gives La Niña conditions a slight edge through mid-winter: about a 55% chance. In order to qualify as a La Niña episode, La Niña conditions have to be present for at least five consecutive overlapping seasons, but of course we can’t know for sure in advance that that will happen. So, in order to qualify as La Niña conditions, we require a forecast that favors that they’ll remain for several months.
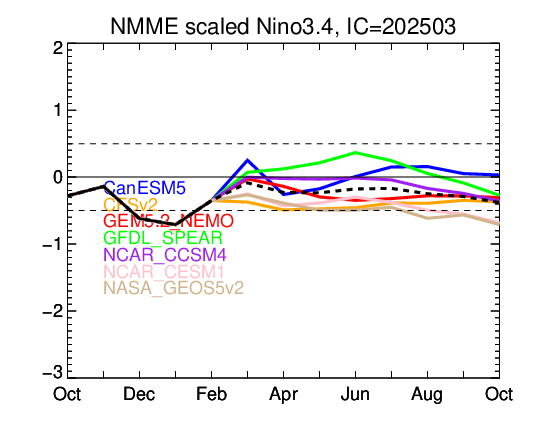
A 55% chance isn’t overwhelming, but not much about this La Niña is right now. Almost all of the computer models predict that the Niño3.4 Index will hover just below -0.5°C cooler than average for a few months, before returning to near-average in the late winter.
The final piece
The whole reason that ENSO (El Niño/Southern Oscillation) matters to countries located far from the tropical Pacific is the changes it causes to global atmospheric circulation. Therefore, we can’t have La Niña conditions without some specific changes in atmospheric circulation. There are several of these changes we look for, all related to the Walker Circulation over the tropical Pacific.
La Niña’s cooler surface waters lead to less rising air, and therefore fewer clouds than average in the central Pacific. Conversely, there is more rising air, clouds, and rain over Indonesia during La Niña. This part of the atmospheric response to La Niña has been pretty clear over the past couple of months.

Places that were more (purple) or less (orange) cloudy in October 2016 than the 1981-2010 average based on satellite observations of outgoing longwave radiation (heat). Thick clouds block heat from radiating out to space, so less radiation = more clouds, and more radiation = clearer skies. Climate.gov map from CPC data.
We’ve also seen stronger-than-average easterly (blowing from east to west) winds in the central Pacific, more evidence that the Walker Circulation is strengthened. However, while this has been fairly consistent since mid-September, these winds are definitely not blowing us away!

Average near-surface winds during October 2016 compared to the 1981-2010 average. The winds along the equator usually blow east-to-west (the trade winds); arrows in the marked box shows the enhanced trades. Climate.gov figure from NCEP/NCAR data provided by NOAA ESRL.
The atmospheric response overall is fairly weak, going along with the borderline cooler sea surface temperatures of this La Niña… but it’s been consistent for a few months, meaning that we are seeing a change on seasonal timescales, and it’s time to formally welcome La Niña conditions! Be sure to check out Mike’s post to see what forecasters think La Niña means for U.S. winter weather.
Comments
weather name
RE: weather name
South American fishermen were the first people to notice the pattern of warmer ocean surface waters that we now call the El Niño/Southern Oscillation, more than 100 years ago. Hence the Spanish name.
Wow, NOAA's visualization lab
La Niña Modoki
La Nina 2016
Does not Meet Australian BoM La Niña Criteria
RE: Does not Meet Australian BoM La Niña Criteria
Yes, the Bureau of Meteorology has different thresholds for El Niño and La Niña. Our two agencies confer, but we develop our forecasts and advisories independently.
RE: RE: Does not Meet Australian BoM La Niña Criteria
RE: RE: RE: Does not Meet Australian BoM La Niña Criteria
RE: RE: RE: RE: Does not Meet Australian BoM La Niña Criteria
Title of story on this webpage
RE: Title of story on this webpage
But then we'd have to forego the Princess Bride allusion! Maybe we should have gone with..."Hello (little), lady." ;-)
Drought US
Is it real La Nina?
RE: Is it real La Nina?
It is possible that the La Nina advisory will not pan out in the coming months -- that is, that the La Nina conditions that have developed recently will not last long enough for the event to be considered a La Nina in retrospect. The advisory is issued when the recent (past one month) conditions satisfy the La Nina criteria, which includes both oceanic and atmospheric conditions, and when the prediction for the coming months suggest a continuation of La Nina conditions. Sometimes the prediction turns out not to happen, and then in a sense we have a false alarm. Even if that happens, the current conditions are triggering some climate impacts through the teleconnections, and some of these will likely continue for a while even if the NINO3.4 warms to less than half a degree below average. The 0.5 degree threshold is a man-made cutoff, in contrast to nature, which works on a continuum. The climate prediction for winter (DJF) for the U.S. shows some familiar La Nina features, such as the tendency toward below normal precipitation over the southern tier of states, based on the expectation of weak La Nina. If the La Nina conditions dissipate sooner than expected, such as during December, these climate impacts will be less likely to happen, but may still occur weakly or in very rough fashion even if the SST is weaker than -0.5 but still, say, -0.3 or so. The ENSO condition historically shows a strong tendency toward persistence between October and December, and this is reflected in many of the dynamical model forecasts for this weak episode. By January, persistence begins decreasing. So, even though the most recent week shows a weakening of the La Nina conditions, we are not ready to say that the forecast is a bust. Intraseasonal fluctuations affect the SST and the SOI noticeably on a week-to-week timescale. But getting back to your question, yes, it is possible that we will fail to achieve the duration required to call this a La Nina, in retrospect. It may only last for 3 or 4 running 3-month periods instead of the required 5. But the collection of predictions from the models suggests it will last long enough to make the 5 required periods.
Comments have been disabled on this article