February 2016 El Niño update: Q & A…and some Thursday-morning quarterbacking
Despite getting a little boost from some strong winds across the tropical Pacific Ocean in January, the warmer-than-average ocean temperatures that drive El Niño have likely peaked. Now that we’re looking out from the other side of the mountain, let’s answer some questions.
So is this the strongest El Niño on record, or what?
This is definitely one of the strongest three going back to 1950. It’s hard to say definitively what single El Niño is the strongest, because there are a lot of different ways to measure strength.
The Oceanic Niño Index, the three-month-average sea surface temperature departure from the long-term normal in one region of the Pacific Ocean, is the primary number we use to measure the ocean part of El Niño, and that value for November – January is 2.3°C, tied with the same period in 1997-98. There are other areas of the ocean that we watch, though, including the eastern Pacific (warmer in 1997/98) and the western Pacific (warmer in 2015/16).
Also, don’t forget the “SO” part of the El Niño/Southern Oscillation (ENSO), which is the all-important atmospheric response. All that extra heat in the tropical Pacific Ocean warms up the atmosphere above it, leading to more rising air, which changes the circulation all around the globe. By one measure (the EQSOI), the El Niño-related changes in the atmospheric circulation in 1997/98 and 2015/16 are tied; by another (the SOI), 1997/98 was stronger.
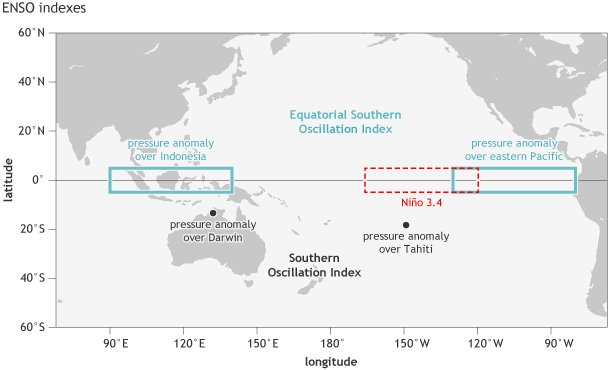
Location of the stations used for the Southern Oscillation Index (Tahiti and Darwin, black dots), the Equatorial Southern Oscillation Index (eastern equatorial Pacific and Indonesia regions, outlined in blue-green), and the Niño3.4 region in the east-central tropical Pacific Ocean for sea surface temperature (red dashed line). NOAA Climate.gov image by Fiona Martin.
We also look at tropical Pacific near-surface winds , subsurface ocean temperatures, upper-atmosphere winds, cloudiness… the list goes on! The image of tropical cloudiness (an indicator of rainfall) below is a good example of how a single index number over a single region doesn’t give you the whole picture of an El Niño’s “personality.”
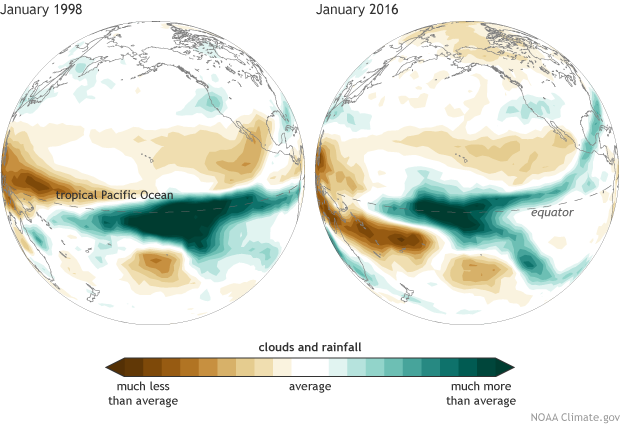
Clouds and precipitation during January 1998 (left) and January 2016 (right). Clouds can be detected by satellites because they block the amount of longwave radiation leaving the earth’s surface (OLR). Image by Michelle L’Heureux and climate.gov, from CPC data.
The El Niño-related cloudiness and rainfall pattern extended farther east along the equator in 1998, stretching all the way to the South American coast. These patterns are closely linked to the changes El Niño causes to global circulation, and therefore to El Niño’s impact on weather and climate.
In short, we can argue over which El Niño is stronger, or we can argue about who’s the better quarterback, John Elway or Peyton Manning. Hm… the Denver Broncos won the Super Bowl in both the 1997 and 2015 seasons…

Denver Broncos quarterbacks John Elway (left) and Peyton Manning (right). Images from Wikipedia.
But I saw in the media that this month’s Niño3.4 is a few hundredths of a degree above January 1998. Isn’t that a record?
Maybe. Maybe not. Part of the difficulty in assigning “record” status in a close contest is that we just can’t measure the temperature of every molecule of water in the tropical Pacific. (And satellites don’t have magical space thermometers.) So there’s always some uncertainty in the measurement.
We checked with our colleagues at NOAA’s National Center for Environmental Information*, who told us that, for this dataset, the ERSSTv4, the uncertainty in those final numbers beyond the decimal point prevents a declaration of “record!” The uncertainty in this one dataset is not huge, as you can see in the shaded area below, but it’s bigger than the difference between 1998 and 2016.
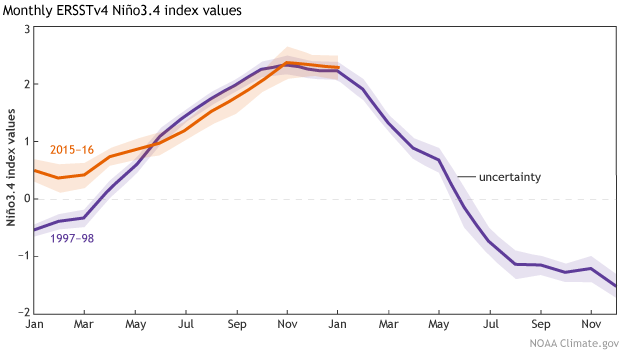
Monthly Niño3.4 Index, from ERSSTv4 data. Shaded area indicates the uncertainty. Image by Michelle L’Heureux and climate.gov, from NCEI data.
Hey, wait a second. Last month, you said the October – December Niño3.4 average was 2.3°C above normal, but now it says 2.2°C. What’s going on there?
This is related to the uncertainty I just mentioned. At the end of every month, there are some missing observations from that month. These observations have to be filled in using a statistical method, and it's not finalized until the end of the next month. There aren't a lot of these points, but enough that they can slightly change the average, which is what happened for October–December.
What’s the deal with California rain? And the drought?
Tom just wrote about that!
Was the East Coast blizzard caused by El Niño?
I think it was caused by the Denver Broncos. I kid!
It’s just not possible to attribute a single storm to one climate influence, especially such a complicated storm as a snowy nor’easter. A lot of components had to come together to create that blizzard, including a cold snap, warm Atlantic Ocean waters to feed moisture to the storm, and a strong frontal system, among others. El Niño’s fingerprint may have been present in some of those factors, but it’s really tough to separate it out. El Niño does tend to create conditions that steer storms across the Gulf states, Florida, Georgia, and the Carolinas; typically, these storms will exit to the Atlantic south of Maryland/Virginia. The more northward track of this storm is somewhat unusual for El Niño-related conditions, but not unheard of.
What’s next?
The official El Niño/Southern Oscillation forecast says it’s likely the tropical Pacific will transition to neutral conditions (sea surface temperature in the Niño3.4 region dropping below the 0.5°-above-normal threshold) in the late spring. The longer-term outlook for early fall is slightly favoring La Niña conditions by September-November, which would be consistent with the historical tendency for strong El Niño events to be followed by La Niña. Computer models still have a wide range of possible outcomes for next fall, though, so stay tuned!
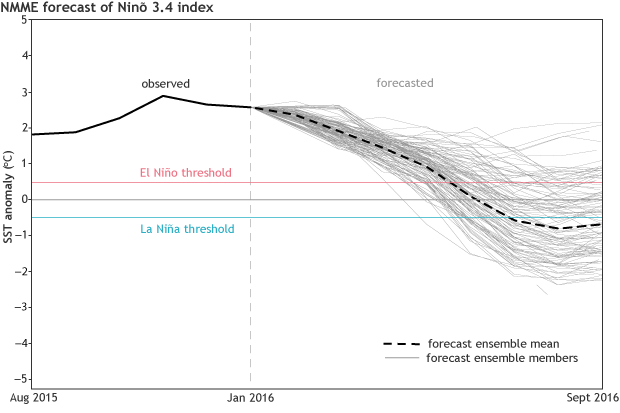
North American Multi-Model Ensemble (NMME) forecast for the monthly Niño3.4 Index. Each gray line is an individual computer model forecast (107 in total) and the black dashed line shows the average. Image by climate.gov from CPC data.
* Lots more information about the ERSSTv4 dataset and uncertainty can be found in this paper: Huang, B., P. Thorne, T. Smith, W. Liu, J. Lawrimore, V. Banzon, H. Zhang, T. Peterson, and M. Menne, 2015: Further Exploring and Quantifying Uncertainties for Extended Reconstructed Sea Surface Temperature (ERSST) Version 4 (v4). J. Climate. doi:10.1175/JCLI-D-15-0430.1, in press. Many thanks to Boyin Huang for his help with this post.
Comments
El Nino
RE: El Nino
Good question. The topic of ENSO and climate change is a fascinating one and, just as importantly, an ongoing one. Please check out the several previous ENSO blog posts which have delved into this scientific question here, here and here. A long story short, ENSO relies not just on the central/eastern Pacific Ocean becoming warmer but the contrast between the central/eastern Pacific and western Pacific (which is cooler than average during El Nino events, vice versa for La Nina). This doesn't necessarily match up if everywhere is warming.
There is evidence though that in the future due to climate change, El Ninos will increase BUT there is also evidence they may not. Which is why at this time the consensus is that we have a low confidence on just how ENSO will change in the future but a high confidence that ENSO will continue to exist.
RE: El Nino
RE: RE: El Nino
You're right that comparing one El Niño to another using a difference from average temperature would be invalid if the average temperature "baseline" exhibited a long-term increasing or decreasing trend over time. NOAA and IRI scientists had to come up with a solution for this that would make sure that conditions at any point in time were compared to the ocean's new normal, not the normal of 50 years ago. I did a story about this a couple years ago, before we launched this blog:
https://www.climate.gov/news-features/understanding-climate/watching-el…
RE: RE: RE: El Nino
RE: RE: RE: RE: El Nino
Hi-- very perceptive comments you are making here. I just want to quickly chime in and point out that this method is not bullet proof, but rather a fix we implemented when we realized we were adjusting events in the 1950s based on the a more recent 1981-2010 base period. To us, it didn't make intuitive sense why an event in the past would be judged on some 30-year climatology well into the future. Supporting that notion, the most recent IPCC consensus indicates there has been no clear change in variance or frequency in ENSO. There are certainly papers that offer ideas, but there is no widespread agreement that ENSO itself has undergone some fundmental change. With that said, it is possible ENSO has already changed, but we have not amassed a long enough record to corroborate it. There is also some discussion in the community, given the already large (and completely natural) intrinsic variability of ENSO, whether such a change would have significant consequences. Finally, ENSO is coupled and more than just SSTs, so in my view, there would probably also need to be some agreement on the changes in other parameters (i.e. rainfall, winds, etc.). It's a tough problem and there are no easy solutions other than to continue to try to do research on how ENSO might change in the future. But our definition will adapt in the future if it becomes out of sync with the consensus.
RE: RE: RE: RE: RE: El Nino
RE: RE: RE: RE: RE: RE: El Nino
No harm done... you made a great point that we hadn't addressed adquately on this blog to date. So thanks for weighing in here and pointing this out. We are always excited to see high caliber comments made on the blog.
April flooding in Argentine Pampas
RE: April flooding in Argentine Pampas
Around 200 km west of Buenos Aires, there is no signal in our current forecast for the coming 3-month period, and there s;dp is no clear, systematic effect expected form El Nino or La Nina, in general, during the Feb-March period. So it looks like there are equal chances for below normal, near normal or above normal rainfall, which I hope is good news. No preferred tendency toward drought or flooding.
La Nina
RE: La Nina
It depends on where you are located. To first order, the expectation is roughtly opposite that of El Nino, although there are some places/seasons where that holds less strongly than others.
High pressure
RE: High pressure
RE: RE: High pressure
It's true, southern Calf has not behaved as if we're in an El Nino during this month. But it's not over. There's still the chance for above average rainfall duirng the remainder of the winter, including late February, March and the first half of April. So far this winter, the southeastern states have been wet and coolish, as expected for El Nino, but not the whole southwest region of the country (incluing Calif). Physical features of this El Nino that MIGHT be relevant to this deviation from expectation are (1) the area of strongly above-average rainfall in the tropical Pacific Ocean does not extend as far eastward, toward the coast of South America, as it has in other strong El Nino events, such as 1997-98 and 1982-83. This is related to the fact that the amount above average that the SSTs are in the eastern one-third of the tropical Pacific is not as great as it was in those two other events. And (2) the SST in the western Pacific is not much below average this time, as it was in the other strong El Nino events. This means the SST different between the western and the east-central Pacific is not as much as it might be. But these features are only possibilities, and are not obvious causes. Both of them are not gross differences from the other two strong El Nino events, but are just a little different. These aspects might just mean that the effects on the climate in the southern tier of states should be as expected for a moderately strong El Nino instead of an outright strong one, so that we would still expect above-average probabilities for a wet winter in the southern tier. So I go back to my first statement, that it's not over. The big ridge over the southwestern part of the country, while persistent in weather terms, is not here to stay for the season.
RE: High pressure
RE: RE: High pressure
Please see my response to you and to Scott, above.
RE: High pressure
RE: RE: High pressure
Please see my response to Charlie and Scott, above. The same reasoning applies to Texas, and especially the western part of the state. This recent ridge really is large, and runs counter to expectations during an El Nino winter.
heat in san diego
RE: heat in san diego
It's easier to say the "warmest on record" if you pick a short period, like the first two weeks of February. I doubt we can say the warmest February on record already, although I have not seen the noaa web page you mention. Maybe they actually are taking the forecast for the next week and a half into account and calling this record already. In any case, the odds are still in favor of getting above average rainfall in San Diego in March, due to the El Nino. It would be more of a "miracle" if you got below average rainfall in March than above average rainfall. The climate influence from the El Nino should "show its face" at some point.
RE: RE: heat in san diego
RE: RE: RE: heat in san diego
I mentioned San Diego becaue I was responding to the comment that referred to San Diego. But the rest of southern California is in virtually the same situation as San Diego, so it appies to the rest of the region as well. Last night (evening of Feb. 17) Los Angeles airport got 0.61 inches of rain, but much of the surrounding area got less, and San Diego only a few hundredths of an inch. It was another failed attempt to make up for the deficit. Now warm, dry weather is to return to the region for the better part of the coming week, and this is a big disappointment. Despite how things look, the new Climate Prediction Center's forecast for the Feb-Mar-Apr period calls for an enhanced probability for above average rain -- about 50% chance, versus the neutral 33% chance. Although this is not a huge probability, it shows a tilt of the odds in the expected direction (wetness) for an El Nino. So the climate forecasters have not given up with southern Calif. getting above average rainfall this winter, even if it means it will happen in the late part of winter or into the spring
Region 1.22
RE: Region 1.22
There was a strong westerly wind event in the east-central tropical Pacific in January, and we have been on the lookout to see if its downwelling Kelvin wave would raise the Nino3.4, then Nino3, and then Nino1+2 readings. It did serve to stop, temporarily, the drop in Nino3.4, but does not appear to be exerting more than a small influence on the behavior of Nino3 and Nino1+2, at least to date. There is still some chance for an upward move in Nino1+2 in the coming few weeks, but since Nino1+2 has already dropped by a considerable amount, even some rise, or pause in the decrease, will not translate to implications for important rainfall activity along the South American coast -- at least not in the coming few weeks. There is still a moderate amount of subsurface heat in the eastern tropical Pacific, so Nino1+2 would not be expected to return all the way to average in the next month or two. But it does now appear less likely that Nino1+2 will be at very high levels during late February and March.
relation between el niño and forest fires emissio and global NPP
el niño, forest fires, emissions and global NPP
El Nino is associated with drought in Indonesia, which in turn has led to an increase in forest fire activity in that region. But even without the forest fires, the fact that the rainfall in decreased would change NPP (net primary production), and the ratio of NPP to GPP (gross primary production). Densely vegetated ecosystems have a lower NPP/GPP ratio than sparsely vegetated ecosystems, and during extended drought periods, such as those linked to El Nino, the vegetation would become effectively more sparse. Forest fires would exaccerbate the vegetation decrease still further. While El Nino may not necessarily change the global average NPP/GPP ratio of close to 0.5, it could affect the spatial distribution of that ratio.
Modificacion de Pronostico
RE: Modificacion de Pronostico
Yes, the forecast for the enhanced chance for above-normal rainfall in southeastern South America has migrated to the north as the time has progressed from October or November 2015 through southern hemisphere summer 2015-16, and now autumn 2016. This is the way it should be, because the teleconnection pattern from El Nino does the same thing, if we look at composites of the rainfall observations during El Nino based on the 1950-2014 time period. During southern hemisphere spring and summer, the pattern of above-average rainfall with El Nino is located farther south than it is during late summer and fall. Also, the strength of that response to El Nino decreases between those two times of the year, and I think our forecasts have shown a slight tendency toward this weakening.
"15 years of climate data not included in warming forecast"
RE: "15 years of climate data not included in warming forecast"
Bill, thanks for your comment, but here we keep the discussions focussed on ENSO, not all climate topics, such as climate change (unless it regards long-term change of ENSO). I encourage you to pose your question to to the Climate.gov general mailbox: climate-portal @ noaa.gov (remove the spaces).
ENSO predictions
RE: ENSO predictions
Your "opposite rule" sounds smart on an initial take, but when reading farther, it doesn't sound very persuasive or scientific. First, since when can you base a rule on a single case? That is very risky indeed. In 2003-04, the ENSO situaiton was neutral, as you said. In 2004-05 there was a weak El Nino, which would normally lead to a forecast for a tilt of the odds toward above normal rainfall during the winter of 2004-05 in southern California. That is indeed what happened, as rainfall was plentiful during December 2004 and January and February 2005. It makes sense. I don't know why the local water experts would sy that there would not be a full lake level in our lifetimes in Lake Arrowhead. How would they be able to come up with a precipitation forecast going out years in advance? It sounds like a statement made in a very pessimistic frame of mind, not an objective statement. Getting back to your "opposte rule", what is your forecast for this winter? A poor rainfall result this winter despite the El Nino? And a healthy rainy season next winter (2016-17) when there is a chance for La Nina?
ENSO and the Caribbean
Yes, the effects of El Nino
Yes, the effects of El Nino are strongest and most reliable in the tropics. The ones near the tropical Pacific are the most certain of all, such as above normal rainfall in Kiribati (and other central Pacific equatorial islands) and below normal rainfall in Indonesia. Temperature effects are also quite reliable, and are mainly for above normal temperature in and around the warmed oceanic waters in the Pacific. After the El Nino has been around for several months, the above normal temperature applies to most of the tropics, and then, with another couple of months' delay, above normal in portions of the extratopics. Note that El Nino contributes to the increase of the global average temperature, especially the year following the onset of the El Nino. That means that even though 2015 is the warmest year on record for the globe, 2016 may be even warmer, even if the El Nino ends before the year is half over (due to the 3-6 delay of the global warming relative to the El Nino).
looking ahead
ENSO impact & Climate Change
Comments have been disabled on this article