Water resources manager Laura Briefer describes how Salt Lake City’s Department of Public Utilities is using climate information to help plan for the city’s future.
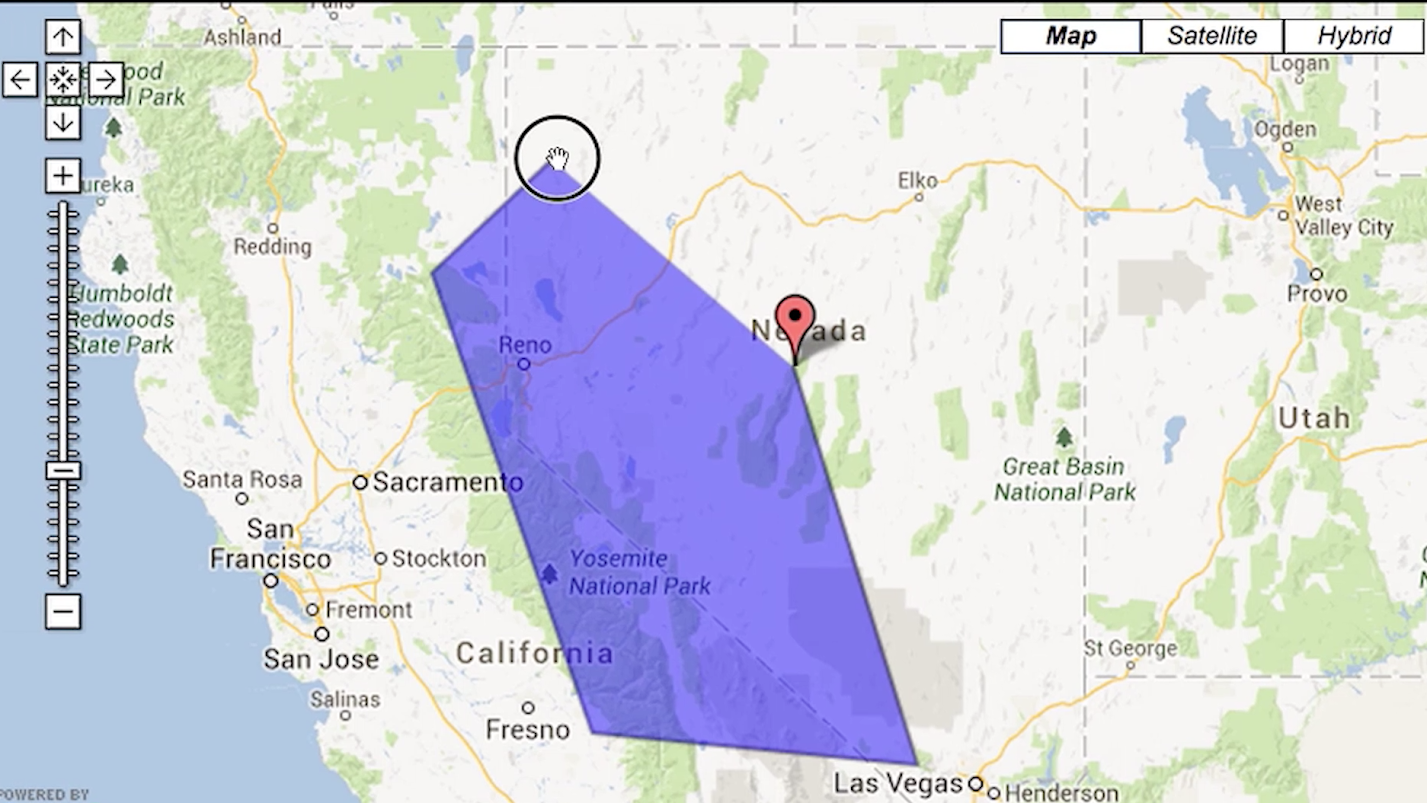
The WestMap climate analysis and mapping toolbox is an interactive, web-based tool that helps users see the climate conditions that underlie droughts, storms, floods, and changes in streamflow.
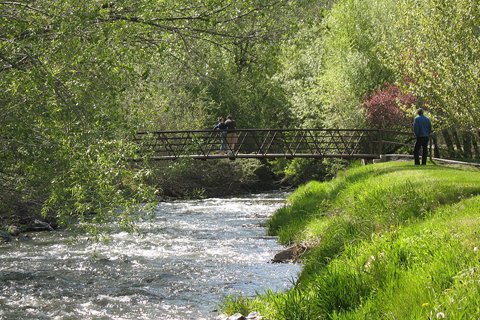
The CanVis tool from NOAA’s Coastal Services Center creates images of potential coastal changes, letting planners and citizens put changes in perspective before they happen.
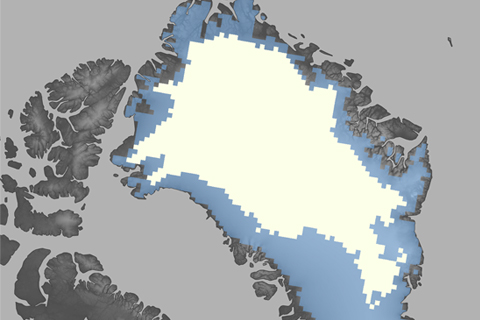
After record-breaking melt during the 2012 season, the 2013 melt extent was more on par with the long-term average. The reprieve from the record warmth and melting of the past six summers is likely connected to a strong positive phase of the North Atlantic Oscillation during summer 2013.
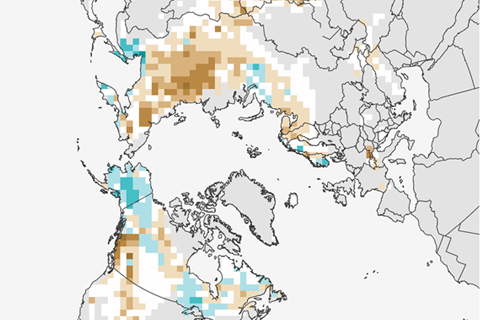
In May 2013, there was record-setting loss of Eurasian spring snow cover, and spring snow cover was below normal again in June—the fourth lowest on record. This is the sixth year in a row that Eurasia has set a new record low in either May or June snow extent.
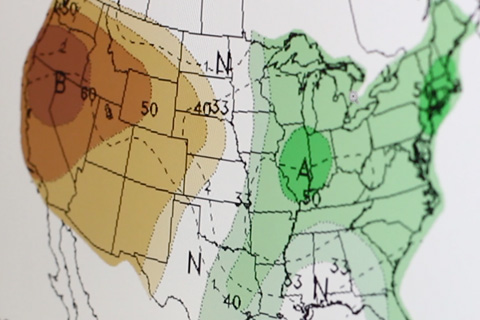
Traditional weather forecasts consist of weather maps that predict exactly how much rain may fall or the maximum daily temperature of an area. NOAA climate outlooks forecast the odds that future weather conditions will be above, below, or near normal.

The U.S. Drought Portal offers access to maps, data, and expert assessments through easy-to-use tools designed to help decision makers monitor, plan for, and recover from water shortages.
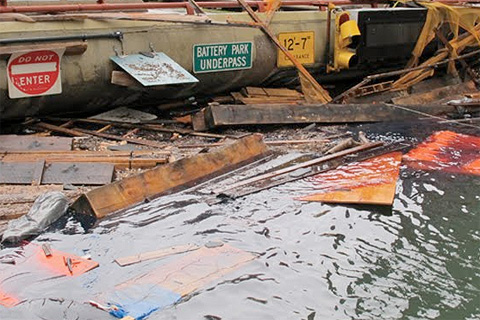
Stunned by Sandy's devastation, the city of New York undertook an ambitious project: to update its long-term sustainability plan using the latest climate science. Their goal was to understand how much sea level could rise, how soon, and just how vulnerable the city would be if some of the more extreme climate change projections turn into reality.
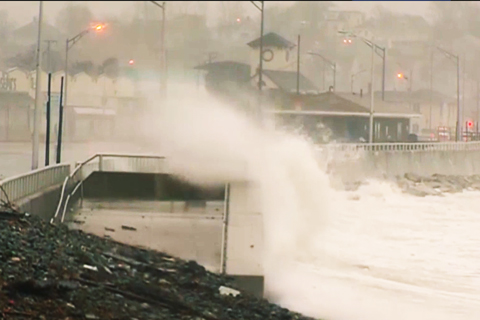
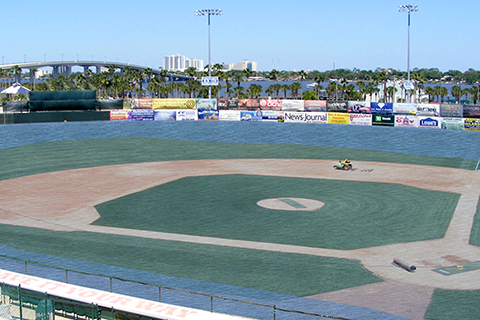
Developed by the NOAA Coastal Services Center, the sea level rise viewer offers access to data and information about the risks of sea level rise, storm surge, and flooding along the coastal United States. The Web-based map has the potential to help people build (or rebuild) in a more resilient way.