How Sandy affected New York City’s long-term planning
Although Sandy had lost its hurricane status by the time it made landfall* on October 29, 2012, the force of the post-tropical cyclone cost 43 New Yorkers their lives and cost the metropolis roughly $19 billion, all while bringing much of the city's transportation and telecommunications services to a halt. In a special report released after the storm, New York City officials called Sandy a "cruel reminder of how destructive coastal storms can be in our dense urban environment—storms that, with climate change, are expected to increase in intensity."
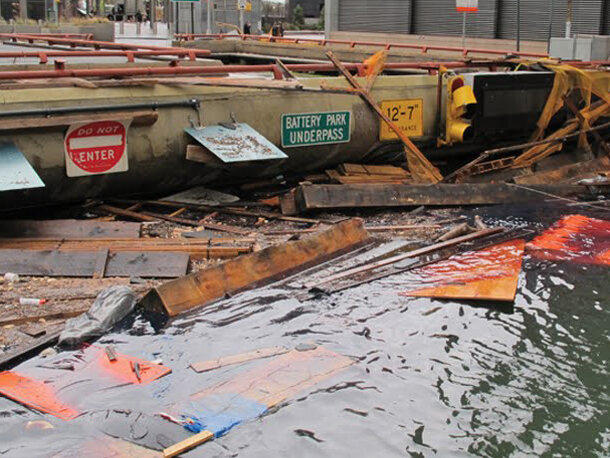
The Battery Park Underpass in Manhattan, a major thruway in the city, flooded with seawater during Sandy. Photo courtesy of the NYC Department of Transportation.
With Sandy's devastation acting as a catalyst, New York City Mayor Michael Bloomberg and the New York City Panel on Climate Change worked with members of the Consortium for Climate Risk in the Urban Northeast (a part of NOAA's Regional Integrated Sciences and Assessments program) as well as other scientific institutions to develop the next version of PlaNYC–New York City's long-term sustainability plan. "Sandy really showed the vulnerabilities of local communities, ecosystems–things like public health," said Radley Horton co-principal investigator and research coordinator for the Consortium. Horton was also the climate science lead for the latest PlaNYC report: "A Stronger, More Resilient New York."
The climate scientists working together on the report, which included researchers not only from the NOAA-funded Consortium, but also from the Federal Emergency Management Agency (FEMA) and independent research institutions, were given a hard task: to compile the most up-to-date climate information within three months. Lawmakers said they wanted the most current climate science to influence their decisions regarding the city's future plans for everything from infrastructure to community preparedness.
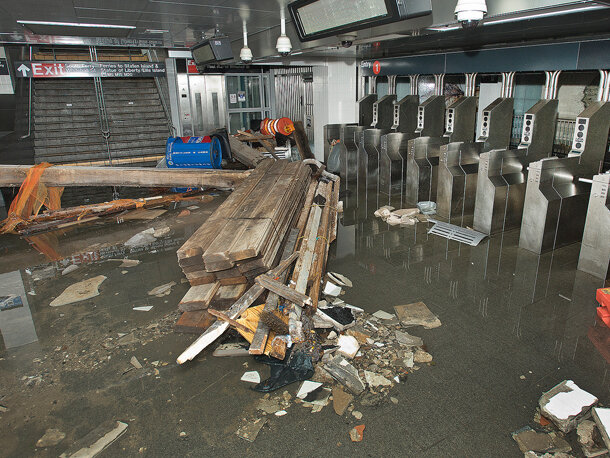
New York's South Ferry subway station after it was flooded by seawater during Sandy. Photo courtesy of the Metropolitan Transportation Authority, Patrick Cashin.
To help New York City plan for its future in a climate-smart way, the scientists working on the report used NOAA tide data as a way to understand both historical sea level rise in the region and historical flood risk, something Horton said "serves as a foundation for projections of future sea level rise and future coastal storm risk." Data from NOAA's National Climatic Data Center and the United States Historical Climatology Network acted as baselines to determine future predicted increases in air temperature, precipitation and sea level rise, as well as to predict quantitative changes in extreme events such as heat waves and cold weather events, intense precipitation and coastal floods at the Battery in southern Manhattan.
The scientists also used NOAA weather station data as a way to understand recent trends in extreme events and how those trends might evolve in the future. For example, by combining normal astronomical tide data from NOAA Tides and Currents (a product of the Center for Operational Oceanographic Products and Services) with the storm-generated surge from Sandy, scientists determined that the storm tide at the Battery was 14.1 feet above mean lower low water. (In places that have more than one cycle of high and low tide each day, the "lower low water" is the height at the lower of the two tides.) In contrast, the mean range of tide at the Battery is 4.53 feet. Data from Sandy and other hurricanes and nor'easters can help scientists predict potential inundation from future storms.
The scientists also partnered with NOAA, FEMA and the U.S. Army Corps of Engineers to create the Sea Level Rise Tool for Sandy Recovery. This tool was designed to help communities, residents, and other stakeholders consider risks from future sea level rise in planning for reconstruction following Sandy. It allows state and local officials, community planners, and infrastructure managers the opportunity to understand possible future flood risks from sea level rise under extreme conditions such as those during Sandy and use that information in planning decisions. The New York City Panel on Climate Change provided regional sea level rise scenarios for the five boroughs in New York City out to 2050. These scenarios include sea level rise from both ocean warming and ice sheet melt, and factor in local conditions such as vertical land movement and regional climate variations.
The report states that if these extreme scenarios prove true, there could be four times more people living in the 100-year floodplain in New York City than what was previously estimated based on old maps, which don't consider sea level rise. "You've gone up from about 200,000 people in the New York City flood zone to about 800,000 when you update the flood maps and consider the 90th percentile sea level rise scenario," said Horton.
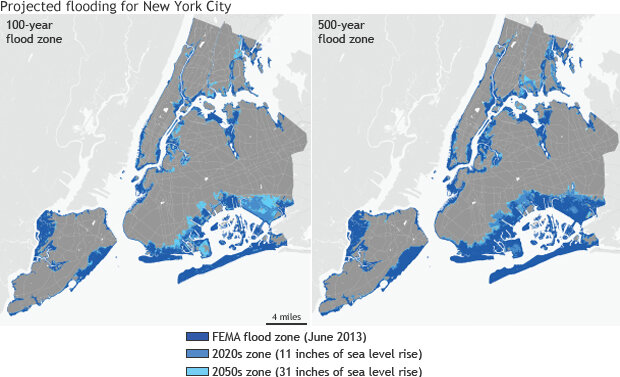
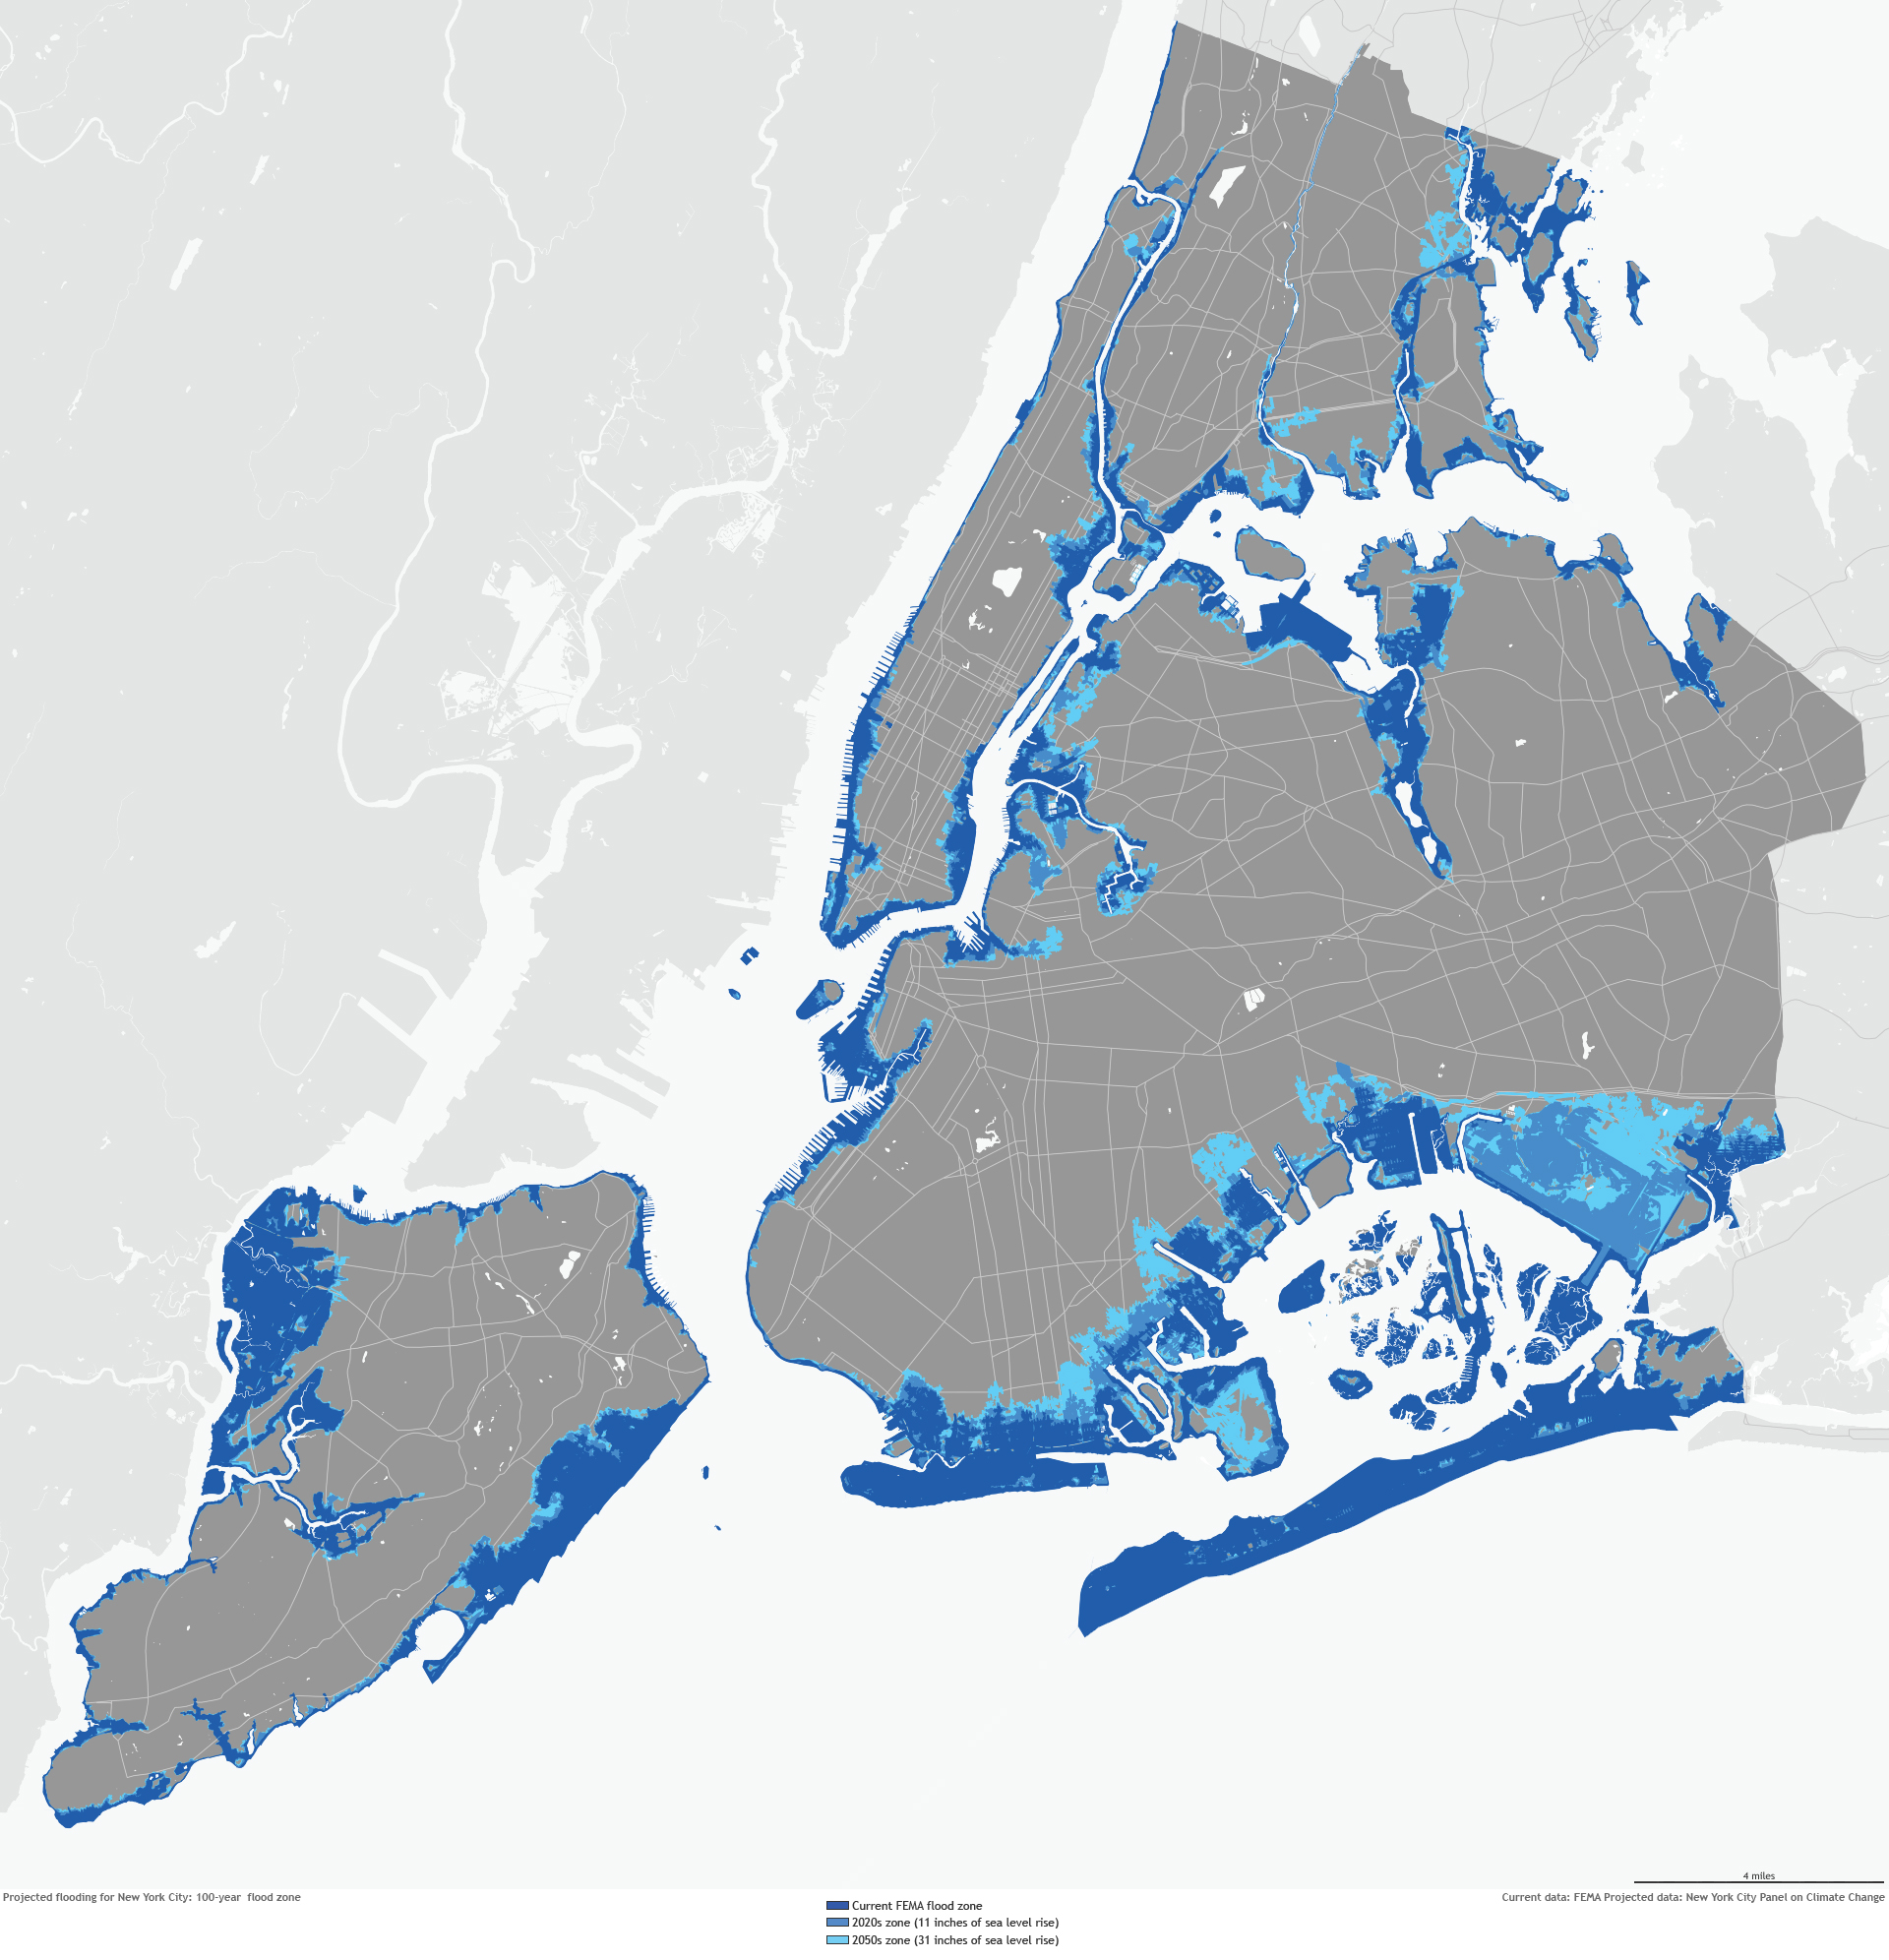
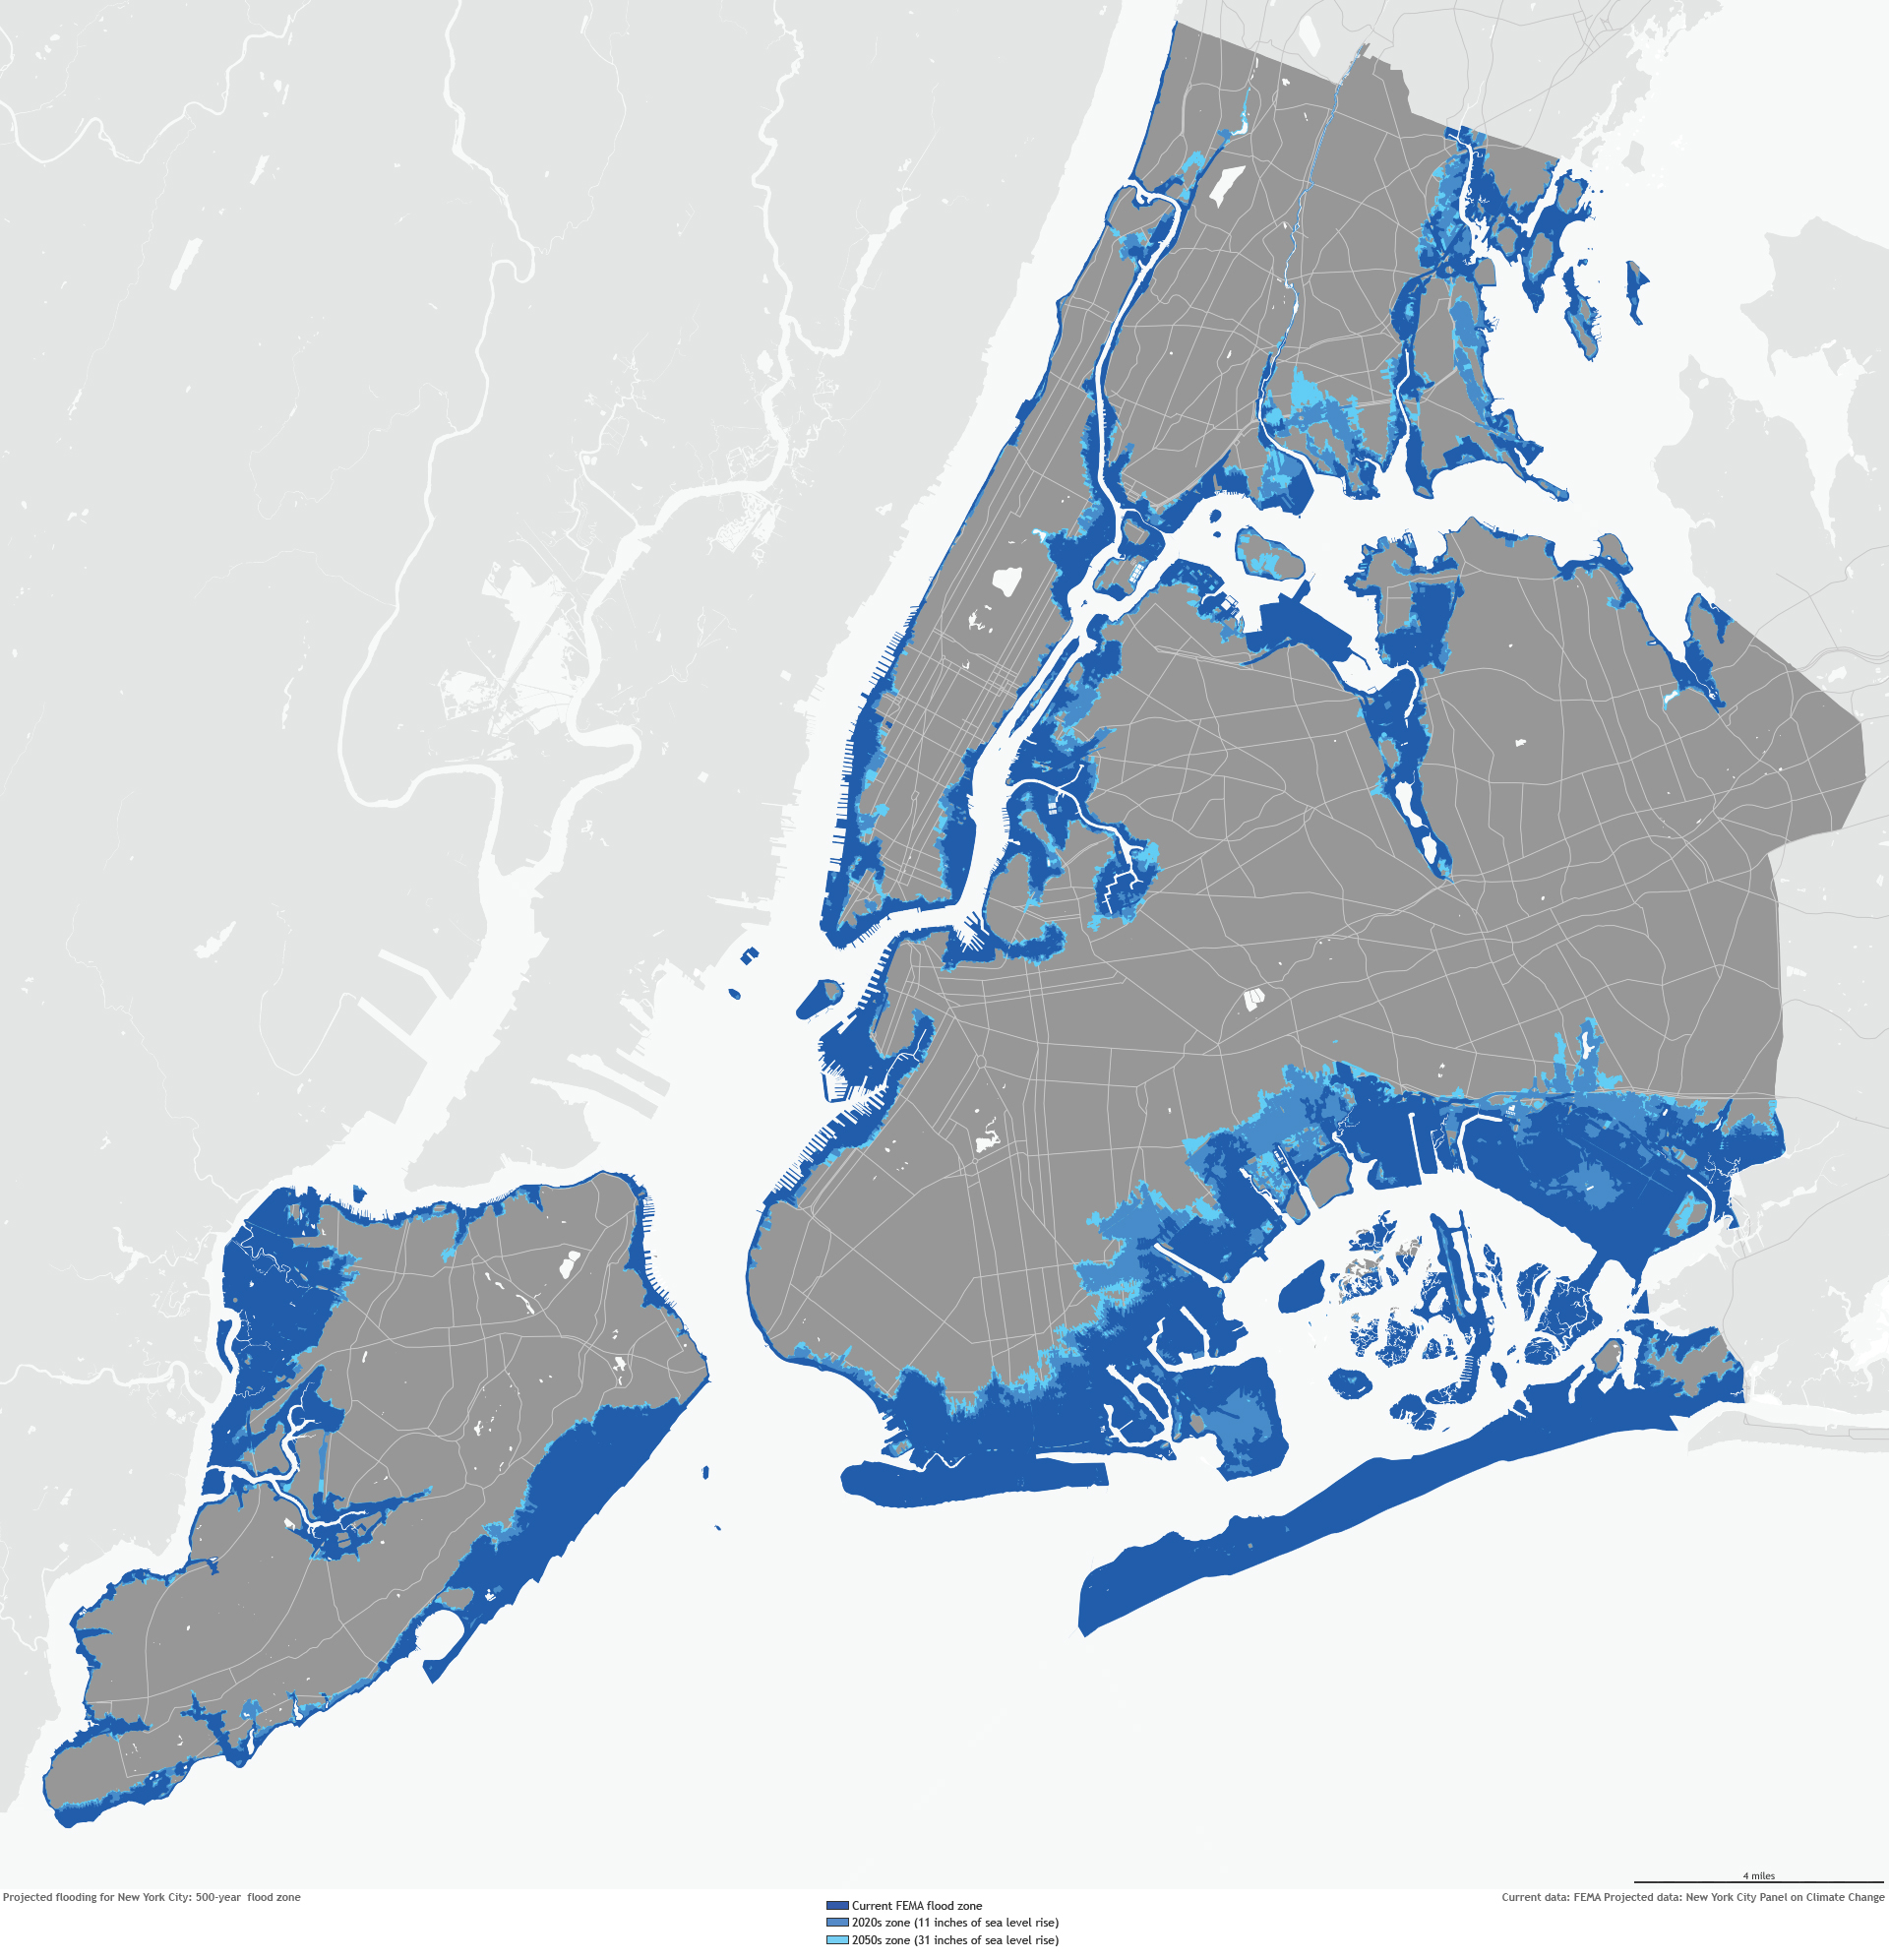
Areas projected to be inundated during a 100-year flood (left, large version) and a 500-year flood (right, large version). Each map shows how the current FEMA flood zone (dark blue) will grow by the 2020s (medium blue) and 2050s (light blue) under an extreme sea level rise projection of 31 inches by 2050. Areas in the 100-year flood zone have a 1 percent chance of being flooded annually. Areas in the 500-year flood zone have a 0.2 percent chance of being flooded annually. Maps by NOAA Climate.gov based on data courtesy FEMA (current) and the New York City Panel on Climate Change (projected).
"New York City has to be commended for embracing the science and fully acknowledging the risks," said Horton, who added that in the report, the city considered extreme sea level rise scenarios within the 90th percentile, an almost worst-case scenario of 2.5 feet of sea level rise by 2050. "On its own merit, there's value for the city to be able to say 'We went with the latest science.' It's not just about the numbers, it's about truly embracing the risk- and science-based approach," he said. "[New York City] absolutely embraced the science."
The report also focused on the potential costs of storms like Sandy in the future given projected sea level rise. "While Sandy caused about $19 billion in losses for our city, rising sea levels and ocean temperatures mean that by the 2050s, a storm like Sandy could cause an estimated $90 billion in losses (in current dollars)—almost five times as much," said Mayor Bloomberg in the report's introduction. After outlining the potential losses, Bloomberg put forth a plan including coastal protection measures and major power and building protections that, he said, could reduce expected losses by up to 25 percent.
"By moving forward with the latest science, New York City has the information they need to help support decisions about where to spend money on elevating and protecting, about difficult societal decisions, about who should spend what, and when the spending should be done to help reduce risk," said Horton. For its part, the city put forth a set of initiatives in PlaNYC, including the launch of a coastal protection study, the launch of an interactive Web platform for communicating flood-related risk information, and amendments to construction codes for new and existing health care facilities within the city, along with many other potential milestones.
"By combining officials from NOAA, from New York City, and members of the scientific community, a product was developed that bridges the local up to the national scale," said Horton. "It's an example of partnering between the federal and local scale that perhaps can serve as a template for other regions."
*[Correction] The article originally said "...made landfall in New York City...," but 'landfall' refers specifically to where the center of a storm intersects a coastline. The center of Sandy came ashore in New Jersey, but hurricane-force wind gusts occured in 6 other Mid-Atlantic States, including New York. For more detail on Sandy's life cycle, please see the NOAA Technical Report on Hurricane Sandy (pdf).
Links
New York City Special Initiative for Planning and Recovery
New York City Panel on Climate Change: Climate Risk Information 2013