
Ron Stouffer and Gabriel Vecchi of NOAA’s Geophysical Fluid Dynamics Laboratory in Princeton, N.J., share their experiences working on one of the most comprehensive scientific documents in history.
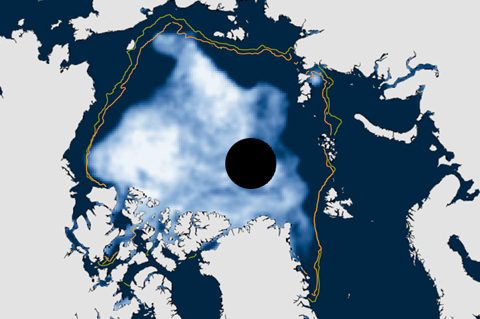
To be consistent with NOAA's use of 30-year periods for the official "climate normals," the National Snow and Ice Data Center switched its baseline period for sea ice analyses from 1979-2000 to 1981-2010. Compared to the new normal, the low ice conditions of the recent past will appear less abnormal than they used to.
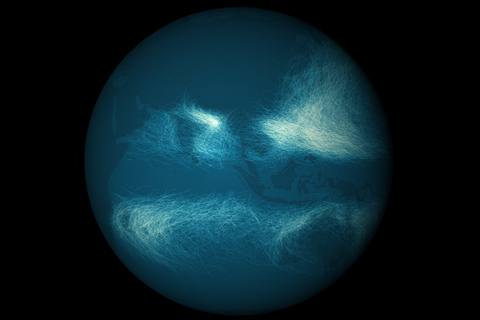
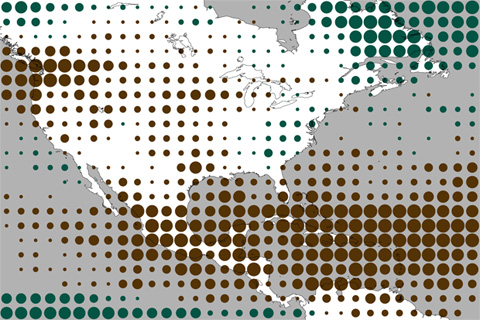
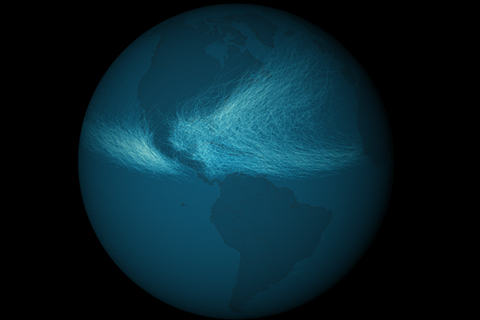
Maps of the thousands of storms that have passed through the Eastern Hemisphere tropical oceans in the past century or so reveal a more crowded landscape than similar maps of the Western Hemisphere. Unlike the Western Hemisphere, where storms are mostly confined to areas north of the equator, the Eastern Hemisphere sees storms in both north and south tropical waters.
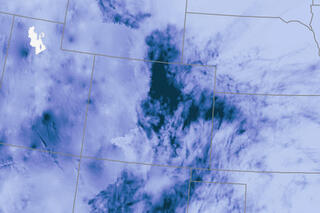
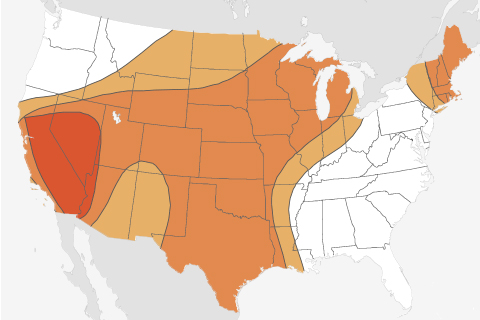
Historic Rainfall and Floods in Colorado
September 17, 2013
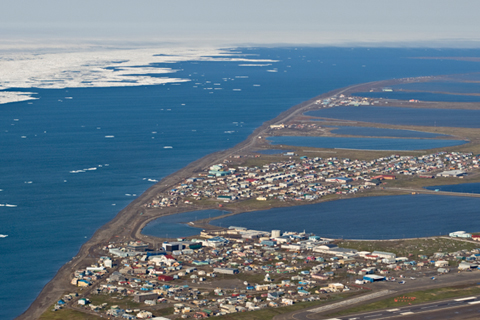
Since 2002, Octobers in Barrow, Alaska—America's northernmost town—are regularly near the warmest on record, thanks to the retreat of sea ice. The warming hinders traditional hunting activities, makes the town more vulnerable to storm surge flooding, and thaws the frozen ground to greater depths, which destabilizes roads, house foundations, and traditional underground freezers.
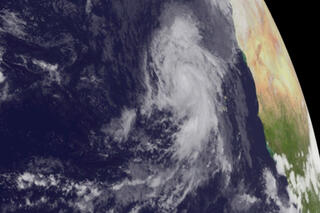
Understanding how extreme events in 2012 were influenced—or not—by human-caused climate change