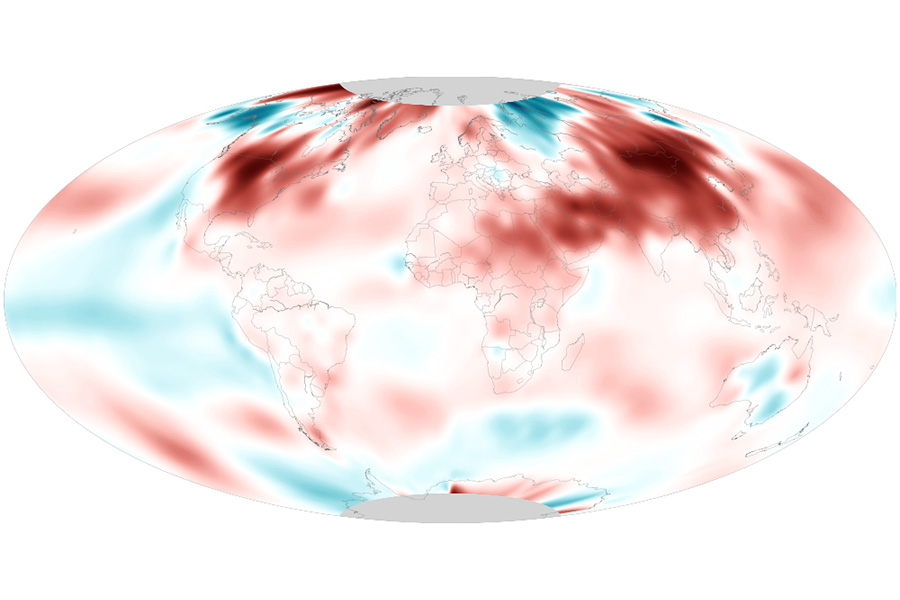
Although this was the smallest warm departure for any March since 2014, it was still the eighth-warmest March for the planet in the 142-year record.
The May 2021 outlook favors warmth for the southern half of the country and a wet East-dry West split.
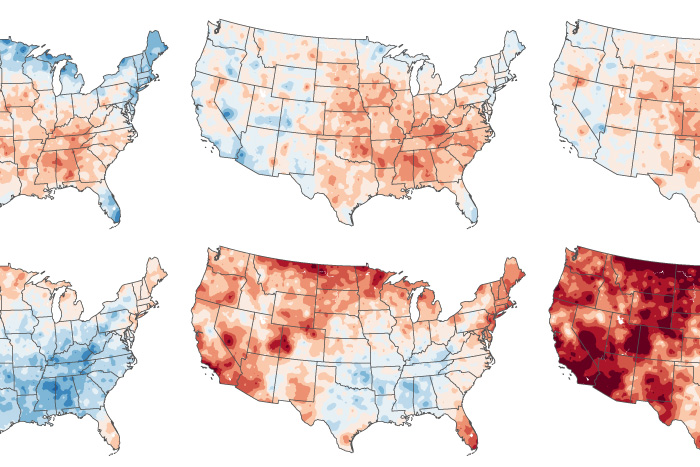
Every ten years, NOAA releases an analysis of U.S. weather of the past three decades, calculating average values for temperature, rainfall, and other climate conditions that have come to represent the new “normals” of our changing climate.
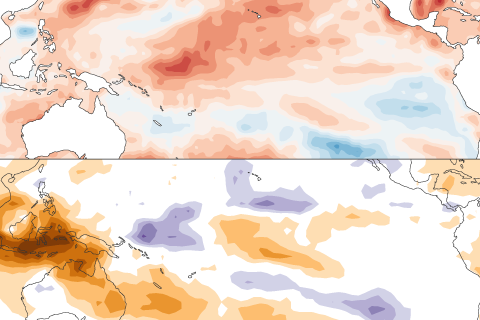
A climate expert proposes an alternative for defining what's average when it comes to predicting El Niño and La Niña.
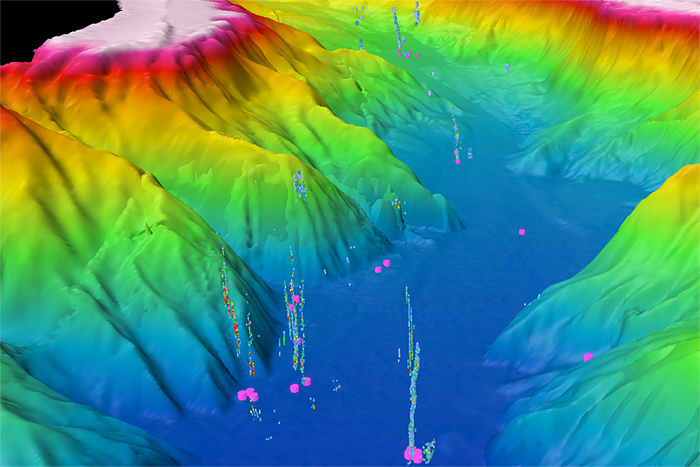
Although the West Coast continental shelf has long been known to host methane bubble streams, scientists used to think those streams were rare. A new study in Frontiers of Earth Science suggests there are more than 1,300 emission sites between California and Canada.

Piecing together Earth’s climate history, tracking marine heat waves, and sharing weather and climate modeling code are just a few of the ways NOAA scientists advanced understanding of the Earth system in 2020.
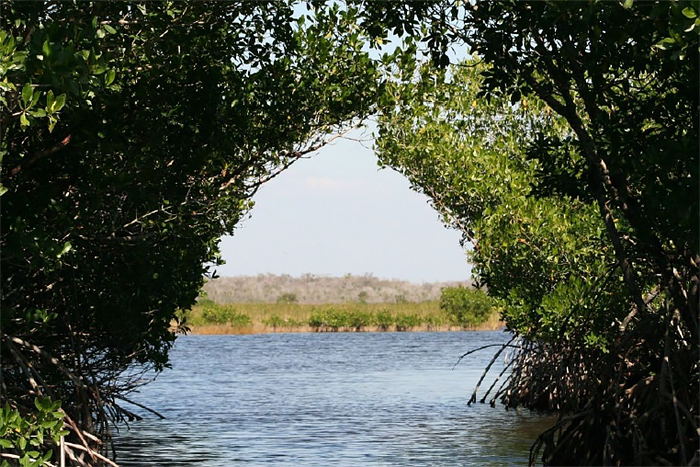
“Blue carbon” is carbon dioxide that the world’s ocean ecosystems remove from the atmosphere, through algae, mangroves, and other means. CPO has developed a briefing sheet for the newly launched NOAA Blue Carbon Inventory (BCI) Project you can review to learn more.

Forest Service personnel have turned to NOAA’s Climate Explorer tool for projections of future climate conditions. Available from the U.S. Climate Resilience Toolkit, the tool provides climate projections for every county in the contiguous United States.
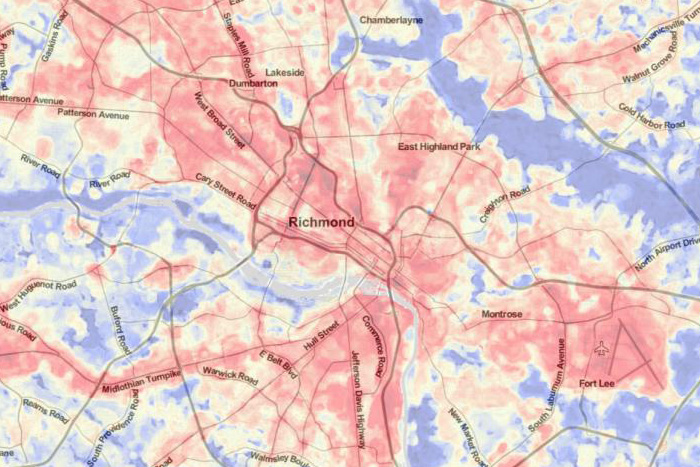
Extreme heat kills more Americans than any other weather event, but not everyone’s risk is the same. Within the same city, some neighborhoods can be up to 20°F hotter than others. In the summer of 2021, community-led campaigns will map the hottest parts of cities in 11 states: Albuquerque, New Mexico; Atlanta; New York City; Charleston, South Carolina; Kansas City, Missouri; Raleigh and Durham, North Carolina; San Diego; San Francisco; and parts of New Jersey, Indiana, Massachusetts, and Virginia.
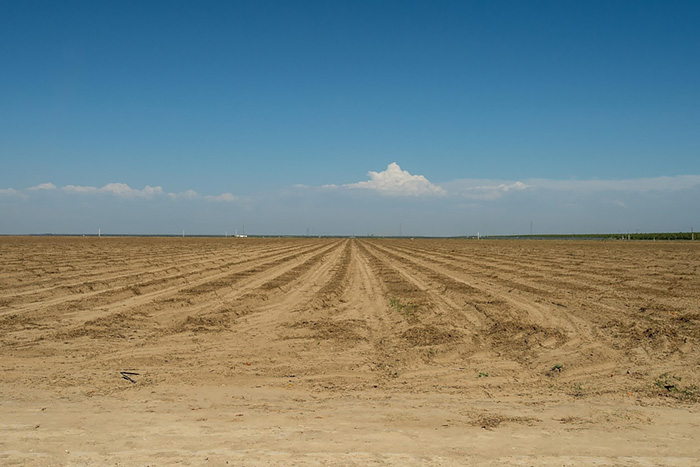
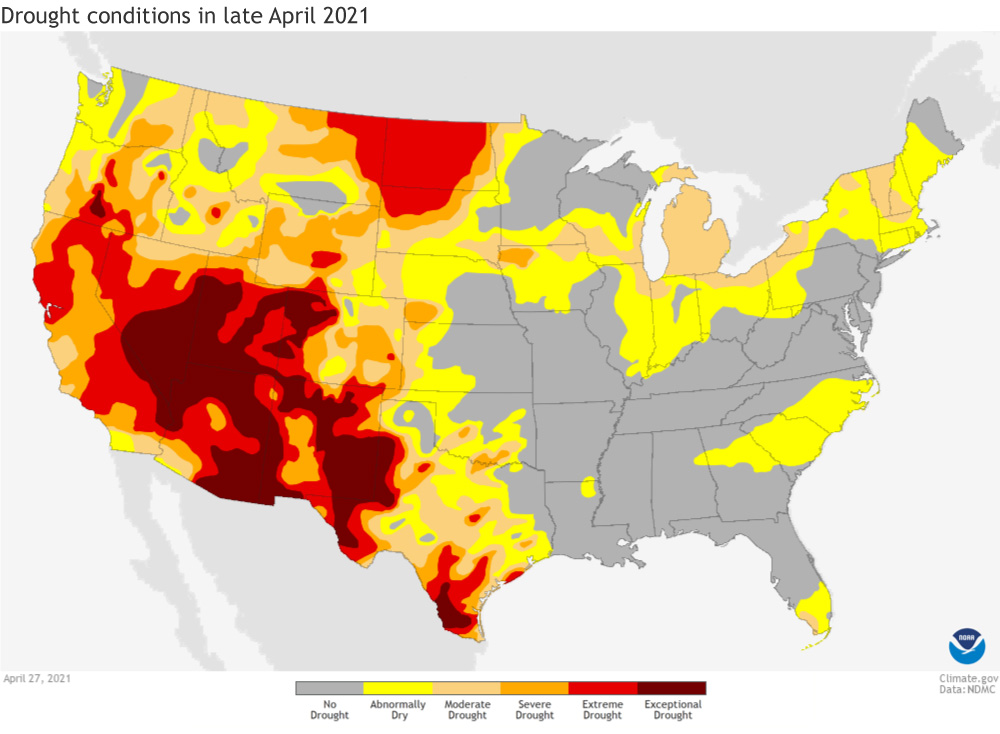
In a special collection of the American Meteorological Society, 13 papers produced by researchers from the third NOAA Climate Program Office’s Modeling, Analysis, Predictions, and Projections (MAPP) program Drought Task Force (DTF3) describe research advances leading to improved monitoring, prediction, and understanding of past droughts.