May 2021 outlook: Warmth favored for southern half of contiguous U.S., wetter conditions for the East
Temperatures are warming up across the country as the calendar shifts into May. So who is most likely to be observing an early summer? The May 2021 outlook from NOAA’s Climate Prediction Center favors a much warmer-than-average month for the southern half of the contiguous U.S. and a wet East/dry West split for precipitation.
A reminder: the climate outlook maps are not a forecast for the absolute temperature or precipitation amounts in May. Instead, they are the probability (percent chance) that May temperatures or precipitation will be in the upper, middle, or lower third of the climatological record (1981-2010) for April. (Note: the climatological record will shift to 1991-2020 later this year). We refer to these categories as “well above” and “well below” average. The colors (red or blue for temperatures, brown or teal for precipitation) indicate which outcome is the most likely. Darker colors reflect higher chances of a given outcome; not more extreme conditions. Head to the end of this post for more on the math behind the outlooks.
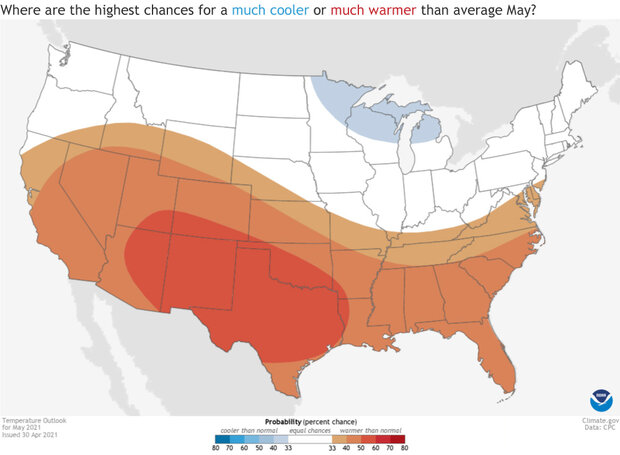
Places in the Lower 48 states where the forecast for May 2021 favors a much colder than usual May (blue colors) or much warmer than usual May (red), or where the probability of a cold May, a warm May, or a near-normal May are all equal (white). The darker the color, the stronger the chance of that outcome (not the bigger the departure from average). NOAA Climate.gov map, based on forecast data from NOAA CPC.
Warmth predicted for the southern half of the contiguous U.S.
Much of the country is again favored to observe monthly temperatures falling on the warmer side in May. In particular, there is a tilt in the odds towards a much hotter-than-average month for the southern half of the country. The highest likelihood for above-average temperatures falls over the desert Southwest and Texas (50-60%). The only areas where odds favor below-average temperatures are over the Great Lakes and western Alaska.
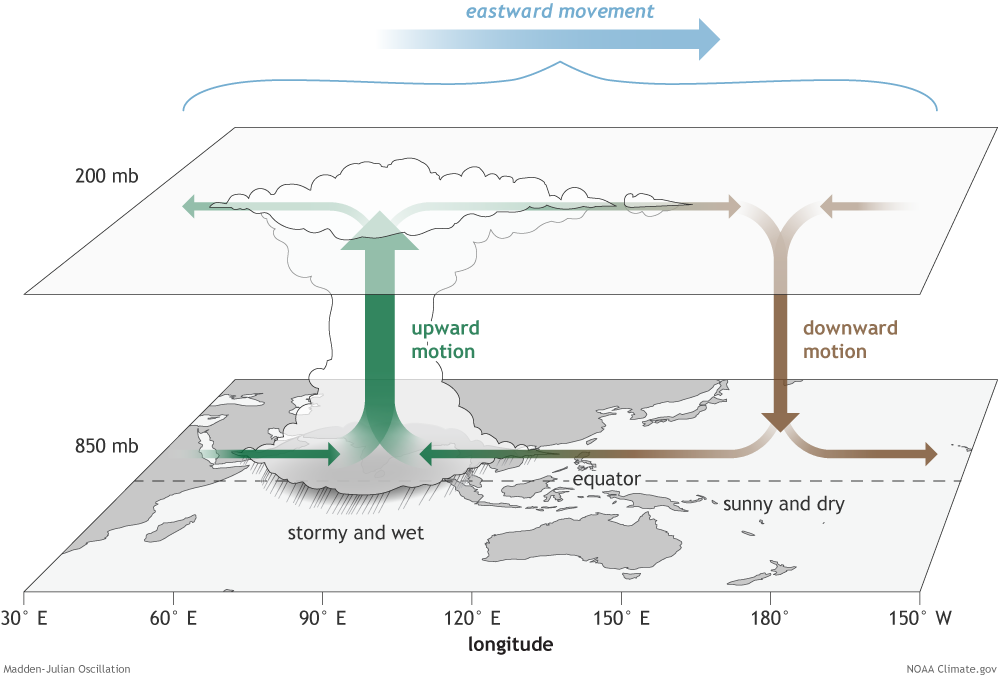
Forecasters were dealing with a bunch of competing climate influences on May’s likely climate patterns when they were making the outlook this month. On one hand, the La Niña in the Pacific Ocean—the cool phase of the El Niño-Southern Oscillation climate pattern—appears to be coming to an end, diminishing its influences on patterns across the country, but not removing them completely. On the other hand, an ongoing Madden-Julian Oscillation event in the tropics could set things up for colder temperatures, especially across the eastern U.S. And of course, forecasters also were looking at the output of various climate models as well as the recent temperature trends.
What did all of this mean? Forecasters decided that conditions looked a little less favorable for much above average warmth in the East than they seemed in mid-April, when they issued the first May outlook. They also introduced a region of below-average temperature probabilities for the Great Lakes due to the forecast over the first two weeks of the month.
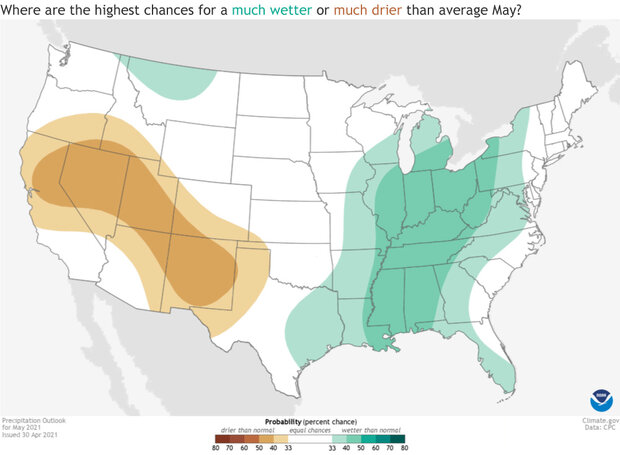
Places in the Lower 48 states where the forecast for May 2021 favors a much wetter than usual May (green colors) or much drier than usual May (brown), or where the probability of a wet May, a dry May, or a near-normal May are all equal (white). The darker the color, the stronger the chance of that outcome (not the bigger the departure from average). NOAA Climate.gov map, based on forecast data from NOAA CPC.
Wetter-than-average conditions favored for the East, drier-than-average conditions for the West
The expected May precipitation patterns for the contiguous U.S. are split between the eastern and western halves of the country. The highest likelihood for a wetter-than-average month is across a north/south swath from the Gulf Coast in Alabama/Mississippi to the Great Lakes (40-50%). In contrast, the expectations are for another much drier-than-average month for the Southwest stretching to the Mountain West and central/northern California.
The forecast wet signal across the eastern U.S. is due in part to the current storm system bringing severe weather and dousing rains across the area as we speak. This rain alone increases the chances for much above-average monthly precipitation totals.
Western drought continues
With a portion of the western U.S. favored to observe below-average precipitation this month, there appears to be little relief expected to mitigate the ongoing drought across the region. As of the end of April, nearly half the country is in some form of drought, with a huge area stretching across the Southwest suffering through an exceptional drought, the most severe drought category.
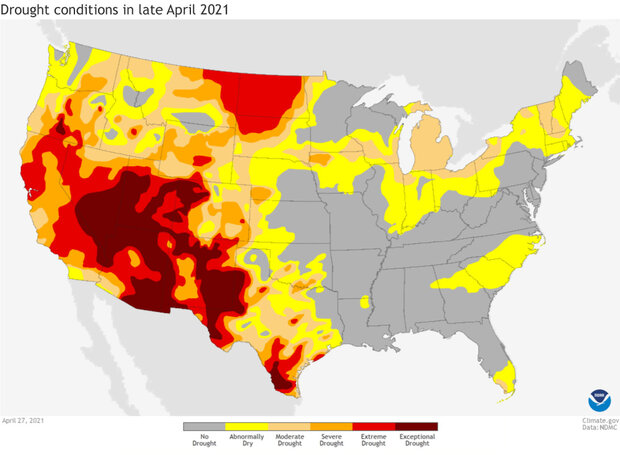
Drought conditions as of April 27, 2021, across the contiguous United States. Severe (orange) and extreme (red) drought conditions were widespread across the West. NOAA Climate.gov image from the Data Snapshots collection, based on data from the U.S. Drought Monitor project.
Unfortunately, the drought outlook for the next month predicts little change. While there could be some drought improvement and removal in southern Texas and in the Great Lakes, another dry month is likely to cause drought to spread in the panhandles of Texas and Oklahoma, Idaho, and southern California.
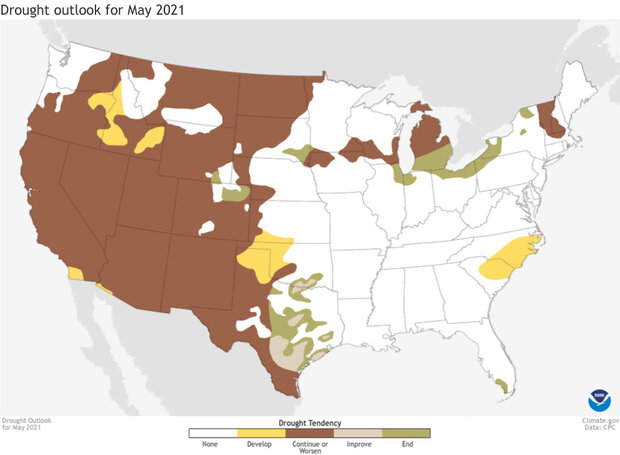
This map shows experts' assessment of how drought conditions are likely to change throughout May 2021. Dark brown areas, such as those covering much of the West, show where drought conditions are likely to persist or worsen, while tan areas show where drought is likely to improve, but not end. Gold shows areas where drought is likely to emerge, while green shows where drought is forecast to end. NOAA Climate.gov Data Snapshots image, based on data from NOAA Climate Prediction Center.
To read the entire discussion of the monthly climate outlooks from the Climate Prediction Center, check out their website. And head back to Climate.gov later this month for a United States and global climate recap of April 2021.