Costly and inconvenient, high-tide flooding of coastal communities is on the rise. Thanks to higher water levels from El Niño and sea level rise, the number of high-tide flood days in 2018 is projected to be 60% higher this year than would have been common around 2000. Find out what's predicted for your city in this interactive map.
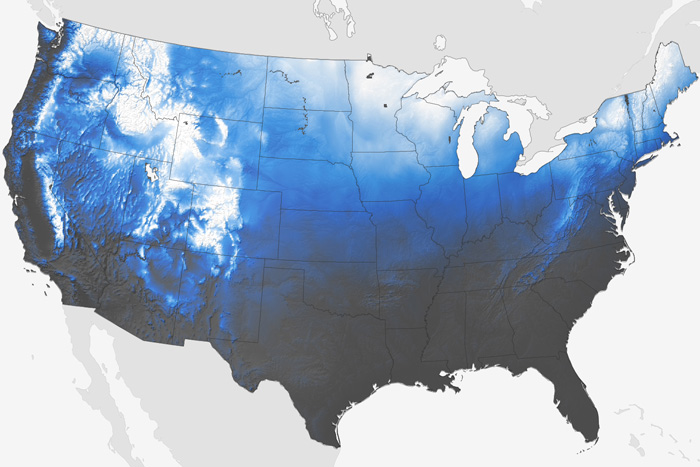
Our interactive map shows the latest date of measurable snow recorded at thousands of U.S. weather stations, based on data through April 11, 2018.
For those of you dreaming of a white Christmas, NOAA has a map showing the historic probability of your dream coming true.
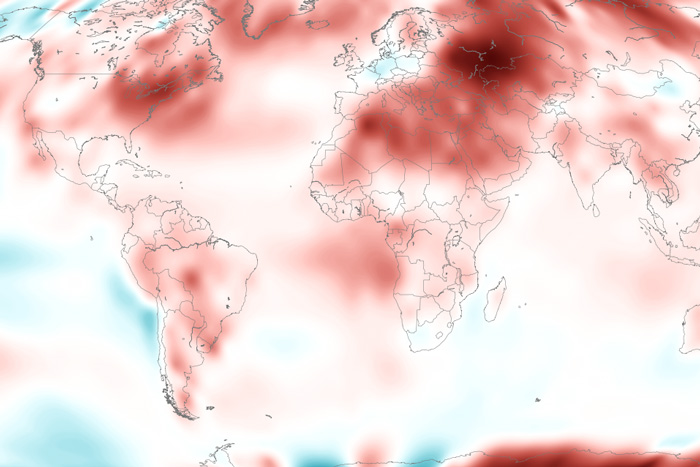
It was the sixth-warmest August on record for the globe. It's very likely that the year will wind up among the 10 warmest years on record.
August was warmer than average, capping off a summer that tied for warmest on record.
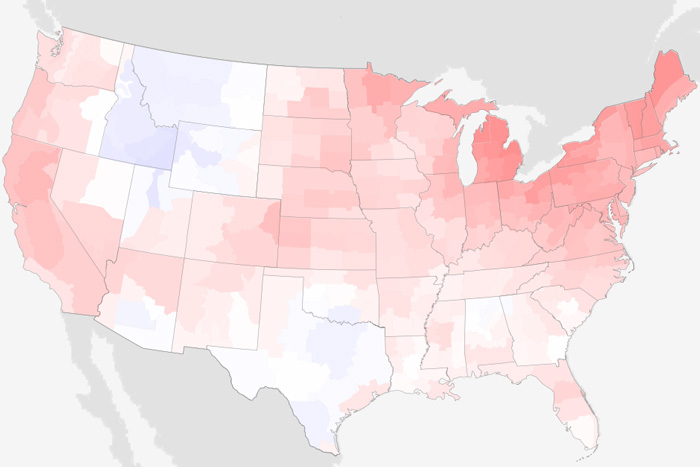
Large parts of the country show no tip in the odds toward either a cold or warm September temperature outcome. The rainfall associated with Hurricane Ida's remnants is likely to be enough on its own to lead to a wetter-than-average September for areas in its path.
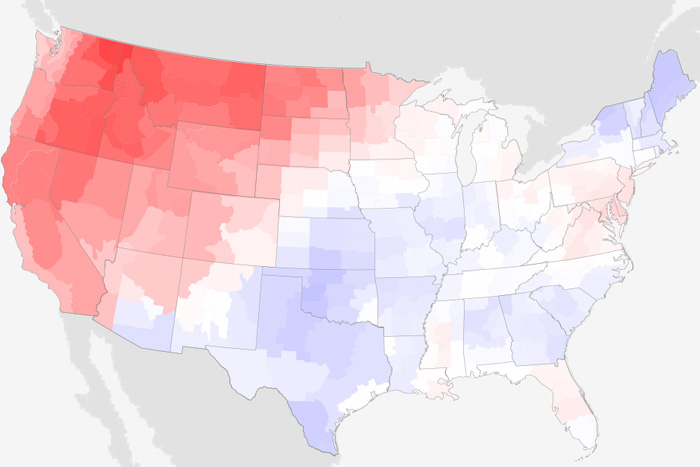
Stories of drought, extreme heat, and fires dominated the weather headlines for the West in July. The central and eastern U.S. were wet and relatively cool.
The findings of their review of more than 14,000 studies are clear: climate change is affecting nearly every part of the planet, and there is no doubt that human activities are the cause.
International report confirms 2020 was among three warmest years on record.
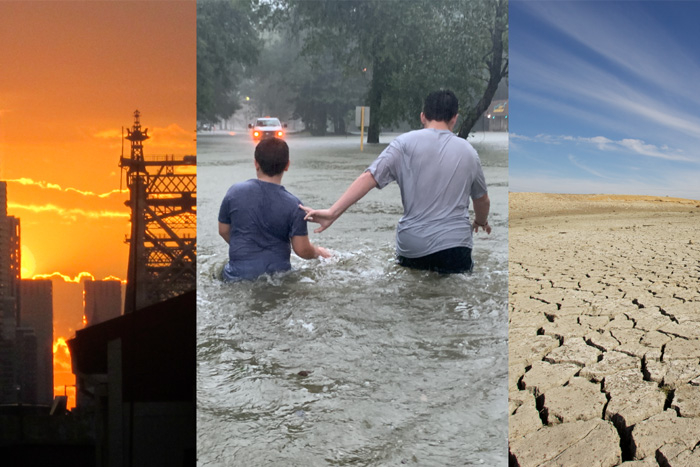
According to NOAA scientists, 2011 was a record-breaking year for climate extremes, not just in the United States, but around the world. Here's an illustrated guide to the year's top ten global climate and weather events.