ENSO forecasters in offices getting coffee
There are many excellent ENSO forecasters around the world who are responsible for providing assessments on the state of El Niño and La Niña for their respective governments. One of my favorite international colleagues is Dr. Ken Takahashi (Instituto Geofísico del Perú) who coordinated the ENSO team in Peru in 2015-16. We just collaborated on a retrospective examination on the 2015-16 El Niño, which will be published in July 2017 (for a pre-print click here). Now we’re faced with an entirely new situation… the potential of a new El Niño in 2017. This comes on the heels of a very strong “coastal El Niño” during February-April 2017, which had very devastating effects on Peru and Ecuador.
I sat down for a remote chat with Ken on May 12, 2017. This transcript has been lightly edited for length and clarity.
Michelle: Wow, that was an impressive Coastal El Niño! Since you had a front row seat can you put it in more context?
Ken: I wish we had been able to predict it with months in advance. It seems to have come out of nowhere. Although the far-eastern Pacific was somewhat warm throughout 2016, the warming in January 2017 was intense and abrupt.
Michelle: Well, that’s interesting because I distinctly remember sitting with you at the December 2016 AGU (American Geophysical Union) meeting and you were speculating that there might be more warming at the tail end of the La Niña of 2016-17.
Ken: Ok. Right. At the time, the sea surface temperatures did have a relatively colder central/warmer eastern Pacific pattern. But for us, the coastal rainfall is favored when sea surface temperatures (SST) are above 26°C, so my speculation was that if it did persist, this could enhance rainfall in March, when our coastal SST is normally highest, even without a formal El Niño. But, as I was saying before, the warming that started in January was way stronger than anything any of us expected.
Michelle: So did any climate models anticipate the coastal El Niño? I know you’ve done some research on model errors. Were they responsible for a lack of a coastal El Niño forecast?
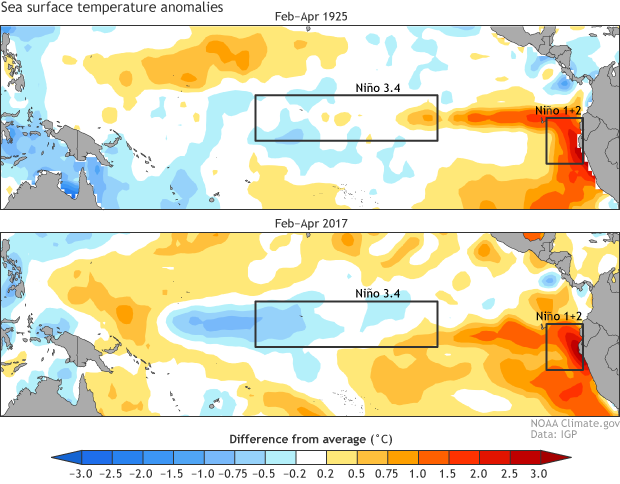
Ken: Well, we are generally skeptical of climate models in the far-eastern Pacific, as they tend to produce a climate that is already too warm and wet along the coast of Peru, so they under-predict warmer and wetter events such as El Niño. But with January conditions, many models suddenly started predicting the onset and maintenance of this coastal El Niño, so this supported our assessment, which was largely based on our analysis of the strong coastal El Niño in 1925, and what followed it (ref. 1).

Image caption
Comparison of sea surface temperature (SST) anomalies during February-April 1925 (top panel) and during February-April 2017 (bottom panel). Red shading indicates above-average SSTs and blue shading represents below-average SSTs. Figure provided by Ken Takahashi (IGP) and modified by Climate.gov.
Michelle: You’ve mentioned the 1925 event to me before…. did that eventually evolve into a bigger, more widespread full-basin El Niño?
Ken: From the limited data we have from 1925 (we only have some ship-based measurements along a few commercial tracks), we see there was a distinct progression of the warming sea surface from the east towards the west, accompanied by development of westerly wind anomalies that are part of the coupled ocean-atmosphere physics of ENSO. This led to the 1925-26 broad-scale Pacific warming, what you and many around the world simply call “El Niño”. ;)
Michelle: Speaking of which, I remember reading a few articles as the 2017 Coastal El Niño was going on and there was some speculation that it was due to climate change. Do you want to comment on that?
Ken: I can speculate, but we’re still studying it. Due to global warming, the surface in the tropics is expected to warm slower than the atmosphere above it. So, because this [temperature inversion] increases stability, a coastal El Niño could be less likely now. But, several climate models predict that climate change will enhance rainfall during El Niño, though not necessarily specific to the “coastal” type (ref. 2). Regardless, we do not know yet why this event was so intense for us.
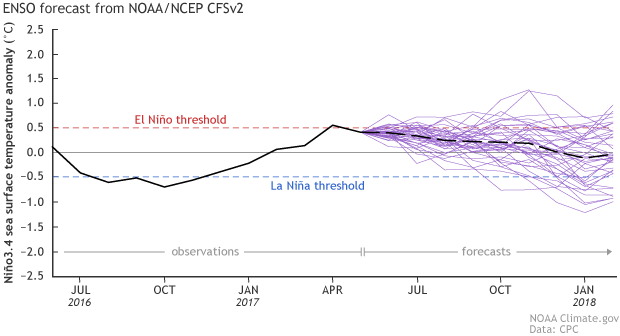
Michelle: So let’s talk 2017! Here’s the latest NOAA/NCEP CFSv2 model forecast.

Image caption
Forecasts of ENSO from the NOAA Climate Forecast System version 2. The solid black line is the observed Niño-3.4 SST data from NCEI. The dashed black line is the average from all the individual forecasts, shown by the purple lines. These forecasts show the spread of different possible outcomes from this model. Values that persist greater than 0.5°C indicate El Niño conditions. Figure provided by Wanqiu Wang (CPC) and modified by Climate.gov.
It’s bailing on its previously predicted El Niño. And it’s not the only one. The Japanese Meteorological Agency (JMA) said the other day they’re 50-50 on El Niño developing. The UK Meteorological Office released a new run of their model, and it shows about half the members sub 0.5°C (rough threshold for El Niño). The Bureau of Meteorology in Australia updated their discussion and they noted the models tend to be retreating as well. So are things falling apart?
Ken: Well, this model has really changed its “mind.” But several other models maintain their El Niño predictions. You must have a theory for this!
Michelle: I wish I did! Unfortunately, in this business it is not uncommon for models to back off or become more aggressive in predicting an ENSO event. This is why we update our official forecasts periodically—to respond to recent conditions. But I noticed that as the CFSv2 began to cool, the short-term forecast in one of the other NOAA/NCEP models is now predicting more anomalous easterly winds (not consistent with El Niño). There is also a suggestion of possible MJO activity, so things could definitely get very interesting coming up here!
Ken: I noticed that, too, but on the other hand we have been monitoring the coupling of the atmosphere to the warm ocean anomalies and it seems like it’s finally happening (unless the strong easterlies materialize), as the La Niña-like convection pattern has finally disappeared and now we have the rainy anomalies starting to shift onto the equator. So, now the prospect of El Niño seems better supported observationally than before.
Michelle: Yes, the atmosphere is less La Niña-like, which is definitely a step in the right direction, but what gives me pause are these short-term wind forecasts and the fact that the supply of subsurface heat doesn’t seem very impressive right now.
Ken: I agree, there are a couple of papers pointing to the strong easterly wind pulse in June 2014 as the proximate cause of the demise of the expected El Niño that year (refs 3 and 4). But from what I’ve seen, the coupling was dead earlier in May. This year we have a “reverse” evolution: We have warming in the east Pacific now and almost no westerly wind anomalies or corresponding convective activity. In 2014 we started with strong westerlies and then they stopped. The fact that this year the warming has kept on going despite apparently less favorable conditions suggests to me that something else is helping out. Perhaps it is that we’re already in a warm decadal phase, in contrast to 2014…
Michelle: Very good points! For our next project, we’ll have to deconstruct what happened in 2017. We’re out of time here, but before you go, I have to ask what do you do when you’re not forecasting ENSO? For the record, I play ice hockey (and watch the Washington Capitals lose annually in the playoffs).
Ken: I’m not sporty, but I do a little swimming in the mornings. More typical relaxing activities would be playing guitar, watching TV and reading. Oh, and I also like to cook (and eat).
Michelle: Good to know you’re not a full-time nerd! I have to admit the idea of having tasty fresh ceviche on hand every day sounds like a good reason to visit or move to Peru.
Ken: But to make it yourself you’d have to get up very early to go to the market to get the best fresh fish. Fortunately there are a lot of restaurants in Lima now. So that’s not so much an issue. ;)
References
- Takahashi, K. and Martínez, A. G., 2017: The very strong coastal El Niño in 1925 in the far-eastern Pacific. Climate Dynamics, http://doi.org/10.1007/s00382-017-3702-1.
- Cai W, Santoso A, Wang G, Yeh S, An SI, Cobb K, Collins M, Guilyardi E, Jin FF, Kug JS, Lengaigne M, McPhaden MJ, Takahashi K, Timmermann A, Vecchi GA, Watanabe M, Wu L, 2015: ENSO and greenhouse warming. Nature Climate Change, http://doi.org/10.1038/nclimate2743
- Hu, S. and Fedorov, A.V., 2016: An exceptional easterly wind burst stalling El Niño of 2014.PNAS, doi: 10.1073/pnas.1514182113
- Min, Q., J. Su, R. Zhang, and X. Rong (2015), What hindered the El Niño pattern in 2014?, Geophys. Res. Lett., 42, 6762–6770, doi:10.1002/2015GL064899.
Comments
Weekly/Monthly ANom leading to 2009 type El nino ?
RE: Weekly/Monthly ANom leading to 2009 type El nino ?
Using a small number of events as analogs is not typically a successful way to make a climate forecast. However, even compared to 2009, the ocean is significantly different, with sub-surface ocean temperature anomalies much weaker than those observed during May and June 2009. In addition, forecasts from most of the dynamical models have gotten progressively less El Nino-like in their forecasts over the past few months. Finally, the current state of the atmosphere has shown no indication of coupling to the modestly positive SST anomalies across the Pacific. While not ruling out that El Nino could develop later this year, the official forecast does favor ENSO neutral to persist through the remainder of the year.
Comments have been disabled on this article