August 2018 ENSO update: game show edition
By nearly all measurements, the tropical Pacific is comfortably gliding along in ENSO-neutral conditions, and forecasters expect that will continue through the rest of the summer. The chance that our old buddy El Niño will be around during the fall is about 60%, rising to 70% by winter, and the El Niño Watch is continued this month.
The price is right
Let’s get started with four contestants from the audience. If you’re a Pacific Ocean ENSO indicator, come on down! The latest weekly Niño3.4 index was just 0.1°C above the long-term average. This is actually a little bit lower than the previous few weeks, but it doesn’t mean that El Niño is less likely. ENSO is a seasonal phenomenon, meaning it’s an average pattern that lasts several months in a row. Weekly fluctuations are expected, and we don’t base our assessments on short-term trends like weekly changes in sea surface temperatures.
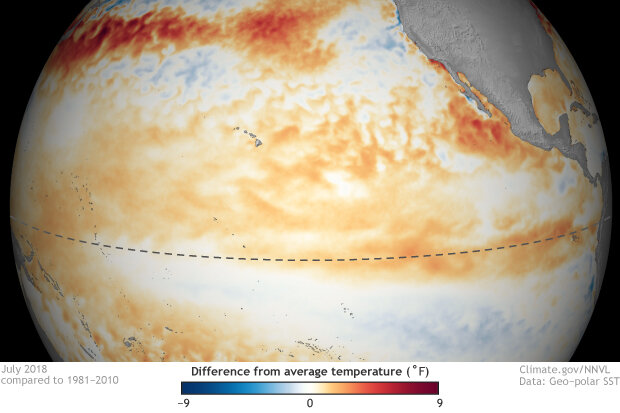
July 2018 sea surface temperature departure from the 1981-2010 average. Graphic by climate.gov; data from NOAA’s Environmental Visualization Lab.
The other temperature indexes we follow in the equatorial Pacific are also near normal. This includes weekly values of 0.4°C in the Niño4 region, 0.0°C in Niño3, and 0.1°C in Niño1+2. Niño4 gets to continue into the pricing round! Have fun, Niño4; we hope you win that washing machine.
Jeopardy!
No consistent differences from average surface winds across the Pacific during August. What are neutral atmospheric conditions, Alex? (OK, so this theme may be the outer limits of my being-funny capacity.) At any rate, the Walker circulation over the Pacific Ocean is generally reflecting the lack of signal from surface water temperatures. During the month of July, there was a bit less rising air and cloudiness than average over both the central Pacific and Indonesia.
Warmer-than-average water under the surface of the tropical Pacific. What is… wait, you’ll take Stop This for 800? Oh, fine, I’ll stop. Even though the temperature anomalies (difference from the long-term average) at the surface decreased slightly over the past couple of weeks, the subsurface heat content is still elevated. The temperature under the central-eastern Pacific (between the date line and 100°W longitude, and ~1000 feet deep up to the surface) was 0.81°C above the long-term average during July. What is the 7th warmest July subsurface temperature since 1979, Alex?
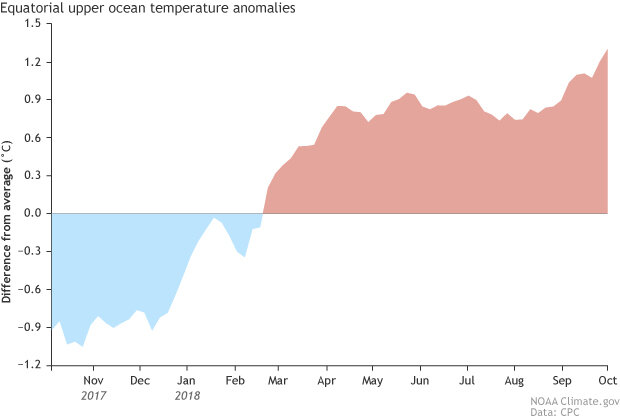
Area-averaged upper-ocean heat content anomaly (°C) in the equatorial Pacific (5°N-5°S, 180º-100ºW). The heat content anomaly is computed as the departure from the 1981-2010 base period pentad (5-day) means. Climate.gov figure from CPC data.
Wheel of fortune
The near-surface winds over the tropical Pacific are very important during the development phase of El Niño. Time for our first puzzle! ENS_ IS A C_UPLED _CEAN-ATM_SPHERE SYSTEM. Want to buy a vowel? This means conditions in the ocean affect the atmosphere, and vice-versa. The normal atmospheric circulation over the Pacific (the WALKER C_RCULAT_ON) is driven by warm air rising over warm water near Indonesia, west-to-east winds aloft, descending air in the eastern Pacific, and returning east-to-west winds near the surface. Those east-to-west winds help to keep warm water trapped in the far western Pacific, continuing the cycle.
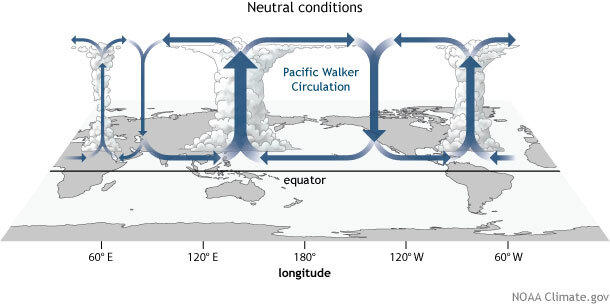
Generalized Walker Circulation (December-February) during ENSO-neutral conditions. Convection associated with rising branches of the Walker Circulation is found over the Maritime continent, northern South America, and eastern Africa. NOAA Climate.gov drawing by Fiona Martin.
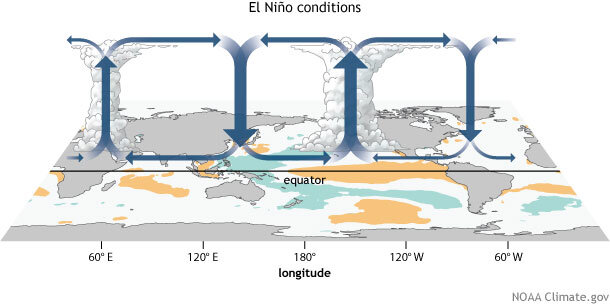
During a full-fledged El Niño event, the change in this relationship is clear, and consistent: the warmer-than-average water in the east-central Pacific causes more rising air over that region, changing the Walker circulation from its average pattern. The near-surface east-to-west winds weaken, and may even reverse so they’re blowing from west-to-east, allowing warmer waters to build in the central Pacific.
When El Niño is developing, though, short-term fluctuations in the near-surface winds can have substantial effects. A period of weaker trade winds can help build El Niño’s warmer surface waters, while a period of stronger trade winds can cool the surface and impede El Niño’s growth. It appears that the trade winds are currently weakening, and may continue to do so through the next week, likely helping push things in the El Niño direction.
Let’s Make a Deal!
What’s behind door number 1? The latest computer models continue to predict that the sea surface temperature in the Niño3.4 region will cross the El Niño threshold (0.5°C above the long-term average) sometime in the fall. Both the statistical and dynamical computer models generally agree, adding some confidence to the ENSO forecast.
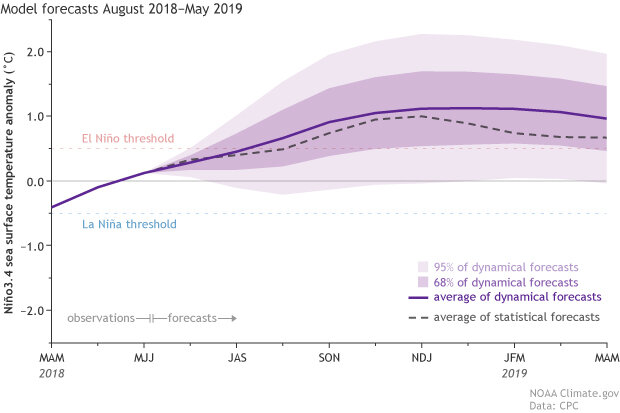
Climate model forecasts for the Niño3.4 Index. Dynamical model data (purple line) from the North American Multi-Model Ensemble (NMME): darker purple envelope shows the range of 68% of all model forecasts; lighter purple shows the range of 95% of all model forecasts. Statistical model data (dashed line) from CPC’s Consolidated SST Forecasts. NOAA Climate.gov image from CPC data.
El Niño can affect the hurricane seasons in both the Atlantic and Pacific. NOAA’s hurricane forecast update comes out today, so be sure to check it out to see how the El Niño forecast factors in.
Thanks for playing!
Comments
Hurricane
RE: Hurricane
Hi Anthony,
The answer to this question, as with so many, is "it's complicated" and "we're working on it." Essentially, if hurricanes are close enough to the equator, they can affect the average wind patterns. Hector is likely a bit far north to have a substantial impact, but may have some weak effect. I'll get into this topic a bit more in my next post!
Cheers,
Emily
Enso Neutral Conditions Prevails July 2018
El Nino-Modoki
RE: El Nino-Modoki
Hi Alex,
We don't focus on distinguishing between canonical or Eastern Pacific El Nino and Modoki for a few reasons. First, the distinction between the two types is not clearcut - the location of maximum sea surface temperature departures from normal for El Nino actually varies rather continuously from the eastern Pacific to the central Pacific. Therefore, it's not trivial to distinguish between two types. Second, the location of the maximum sea surface temperature anomalies is closely related to the amplitude of the event: stronger events tend to be centered more toward the east, whereas weaker events tend to be centered farther west. This means the question of El Nino "flavor" is strongly related to the amplitude, and it is a bit early to pinpoint the amplitude of the coming event. These points are covered in this post, and I strongly recommend that you read this recent post by guest author Prof. Jason Furtado regarding the potential event this fall and winter. You also might like to look at the sea surface temperature patterns as well as the temperature and precipitation patterns that the dynamical models of the NMME predict for the next several seasons.
I also would point out that Tom plans on writing a post in September about how the U.S. impacts of El Nino vary from event to event, so stay tuned for that update!
re: Monthly Forecasts
RE: re: Monthly Forecasts
Definitely okay... we field questions on all sorts of topics related to weather and climate. CPC updates both its monthly and seasonal outlooks on the 3rd Thursday of every month at 8:30AM Eastern (seasonal link HERE). Then CPC updates its monthly outlook again on the last day of the month at 3PM Eastern (monthly link HERE). The reason for this second update that the quality of our monthly outlook benefits from getting information as close as possible to the start of month.
How does this affect the
RE: How does this affect the
That's right - Indonesia tends to be warmer and drier than average during El Nino winters, as Emily recently reminded us with a classic schematic figure in a recent post. So far, the guidance is not suggesting a high probability of a severe El Nino like the 2015/16 event that brought drought and fire to Indonesia, but we will hone in on the intensity of this possible event in the coming months.
Winter
RE: Winter
Of course we have to see how this particular event evolves (or doesn't), but the schematic in Emily's recent post and this article give a good idea of the expected influence of El Nino on the southern US winter. Generally, we would expect a higher chance than normal of cooler and wetter conditions over the southern US.
What are your thoughts on how
Will the potential "El Nino" still be "around" in spring (2019)?
Sailing to the South Pacific marquesas and Gambiers 12/2018
RE: Sailing to the South Pacific marquesas and Gambiers 12/2018
The IRI global seasonal outlooks may be useful for you, Galapagos has an increased chance of being wetter than average:
https://iri.columbia.edu/our-expertise/climate/forecasts/seasonal-climate-forecasts/
For outlooks related to the south Pacific Islands, I recommend this product:
https://www.niwa.co.nz/climate/icu
Comments have been disabled on this article