2021 U.S. billion-dollar weather and climate disasters in historical context
Last week, our team at NOAA National Centers for Environmental Information (NCEI) released the final update to its 2021 Billion-dollar disaster report (www.ncdc.noaa.gov/billions), confirming what much of the nation experienced throughout 2021: another year of frequent and costly extremes. The year came in second to 2020 in terms of number of disasters (20 versus 22) and third in total costs (behind 2017 and 2005), with a price tag of $145 billion.
2021 Highlights
In 2021, the U.S. experienced 20 separate billion-dollar weather and climate disasters, putting 2021 in second place for the most disasters in a calendar year, behind the record 22 separate billion-dollar events in 2020. What really made 2021 stand out was the diversity of disasters:
- 1 winter storm/cold wave event (focused across the deep south and Texas);
- 1 wildfire event (combined impacts of wildfires across Arizona, California, Colorado, Idaho, Montana, Oregon and Washington);
- 1 drought and heat wave event (summer/fall across western U.S.);
- 2 flood events (in California and Louisiana);
- 3 tornado outbreaks (including the December tornado outbreaks);
- 4 tropical cyclones (Elsa, Fred, Ida and Nicholas); and
- 8 severe weather events (across many parts of the country, including the December Midwest derecho).
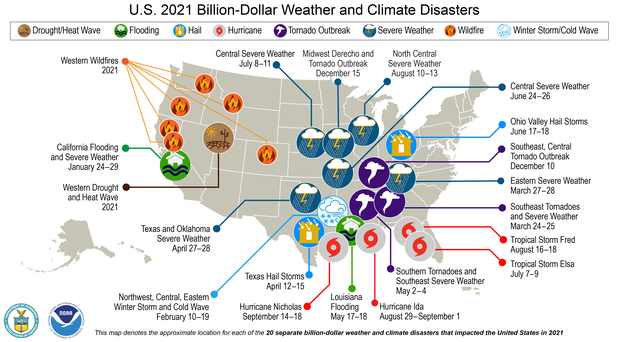
In 2021, the United States experienced record-smashing 20 weather or climate disasters that each resulted in at least $1 billion in damages. NOAA map by NCEI.
2021 was also unusually deadly, in that the 20 events of 2021 caused at least 688 direct or indirect fatalities—the most disaster-related fatalities for the contiguous U.S. since 2011 and more than double last year’s number of 262. In addition, these U.S. disasters also went late into the year, as December produced the Southeast, Central Tornado Outbreak (December 10); the Midwest Derecho and Tornado Outbreak (December 15); and the Marshall Fire in Boulder County, Colorado, on December 30.
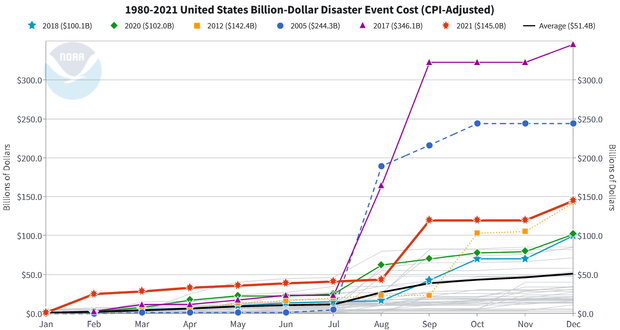
Month-by-month accumulation of estimated costs of each year's billion-dollar disasters, with colored lines showing 2021 (red) and the previous top-5 costliest years. Other years are light gray. 2021 finished the year in third place for annual costs.
Damages from the 2021 disasters totaled approximately $145 billion. (All cost estimates are adjusted based on the Consumer Price Index, 2021). The costliest 2021 events were Hurricane Ida ($75 billion), the mid-February Winter Storm / Cold Wave ($24.0 billion), and the Western wildfires ($10.9 billion). Adding the 2021 events to the record that began in 1980, the U.S. has sustained 310 weather and climate disasters where the overall damage costs reached or exceeded $1 billion. The cumulative cost for these 310 events exceeds $2.15 trillion.
2021 costs in historical context
In broader context, the total cost of U.S. billion-dollar disasters over the last 5 years (2017-2021) is $742.1 billion, with a 5-year annual cost average of $148.4 billion, both of which are new records and nearly triple the 42-year inflation adjusted annual average cost. The U.S. billion-dollar disaster damage costs over the last 10-years (2012-2021) were also historically large: at least $1.0 trillion from 142 separate billion-dollar events.
It is concerning that 2021 was another year in a series of years where we had a high frequency, a high cost, and large diversity of extreme events that affect people's lives and livelihoods—concerning because it hints that the extremely high activity of recent years is becoming the new normal. 2021 (red line) marks the seventh consecutive year (2015-21) in which 10 or more separate billion-dollar disaster events have impacted the U.S. The 1980–2021 annual average (black line) is 7.4 events (CPI-adjusted); the annual average for the most recent 5 years (2017–2021) is 17.2 events (CPI-adjusted).
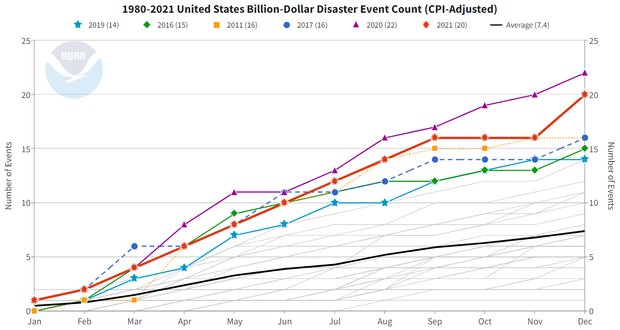
Month-by-month accumulation of billion-dollar disasters for each year on record. The colored lines represent the top 6 years for most billion-dollar disasters. All other years are colored light gray. NOAA image by NCEI.
Increasing trend of high-cost disasters: exposure, vulnerability and climate change influence on extremes
The number and cost of weather and climate disasters are increasing in the United States due to a combination of increased exposure (i.e., more assets at risk), vulnerability (i.e., how much damage a hazard of given intensity—wind speed, or flood depth, for example—causes at a location), and the fact that climate change is increasing the frequency of some types of extremes that lead to billion-dollar disasters (NCA 2018, Chapter 2).
It is important to keep in mind that these estimates do not reflect the total cost of U.S. weather and climate disasters, only those associated with events more than $1 billion in damages. That means they are a conservative estimate of how much extreme weather costs the U.S. each year. However, these billion-dollar events do account for the majority (>80%) of the damage from all recorded U.S. weather and climate events (NCEI; Munich Re), and they are becoming an increasingly larger percentage of the total damage costs from weather-related events at all scales and loss levels.
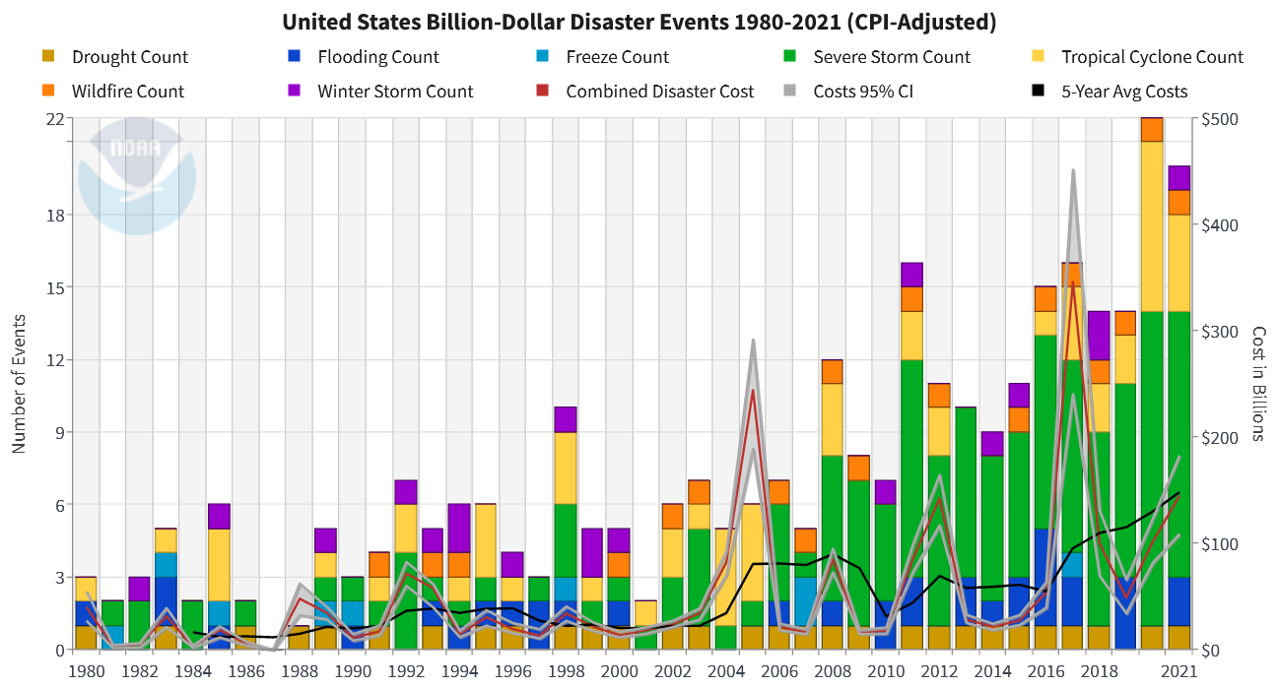
The history of billion-dollar disasters in the United States each year from 1980 to 2021, showing event type (colors), frequency (left-hand vertical axis), and cost (right-hand vertical axis.) The number and cost of weather and climate disasters is rising due to a combination of population growth and development along with the influence of human-caused climate change on some type of extreme events that lead to billion-dollar disasters. NOAA NCEI.
The historically large U.S. losses from hurricanes and wildfires over the last five years (2017-2021) have further skewed the total distribution of extreme weather costs. From 1980-2000, about 75% of all disaster-related costs were due to billion-dollar disasters, and by 2010, the percentage had risen to about 80%. By 2021, it had risen again to about 85% of all disaster-related costs, or $2.15 trillion out of $2.5 trillion.
The increase in population and material wealth over the last several decades, are an important cause for the rising costs. These trends are further complicated by the fact that much of the growth has taken place in vulnerable areas like coasts, the wildland urban interface or river floodplains. Vulnerability is especially high where building codes are insufficient for reducing damage from extreme events. This is part of the reason that the 2010s decade is far costlier than the 2000s, 1990s or 1980s (all inflation adjusted to 2021 dollars).
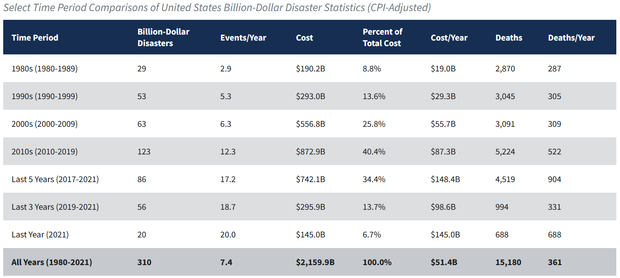
Screenshot of a table of summary statistics of billion-dollar disasters by decade and by latest 1, 3-, and 5-year periods.
However, climate change is also supercharging the increasing frequency and intensity of certain types of extreme weather that lead to billion-dollar disasters—most notably the rise in vulnerability to drought, lengthening wildfire seasons in the Western states, and the potential for extremely heavy rainfall becoming more common in the eastern states. Sea level rise is worsening hurricane storm surge flooding. (Read more about changes in climate and weather extremes in the U.S. National Climate Assessment.) Given all these compounding hazard risks, there is an increased need to focus on where we build, how we build, and investing in infrastructure updates that are designed for a 21st century climate.
Notable U.S. billion-dollar disasters of 2021
Among the many weather and climate-related disasters to affect the U.S. in 2021, the following caused the most damaging impacts and broke numerous records.
Hurricane Ida (August 2021): $75.0 billion, 96 deaths
Category 4 Hurricane Ida made landfall near Port Fourchon, Louisiana, with maximum sustained winds of 150 mph (240km/h) and a minimum central pressure of 930 millibars. Ida was one of three hurricanes in recorded history to make landfall in Louisiana with 150 mph winds, along with Hurricane Laura in 2020 and the 'Last Island' hurricane of 1856. Grand Isle, Louisiana took a direct hit with 100% of its homes damaged and nearly 40% were destroyed. There was heavy damage to the energy infrastructure across southern Louisiana causing widespread, long-duration power outages to millions of people. Parts of New Orleans were without power for nearly a week.
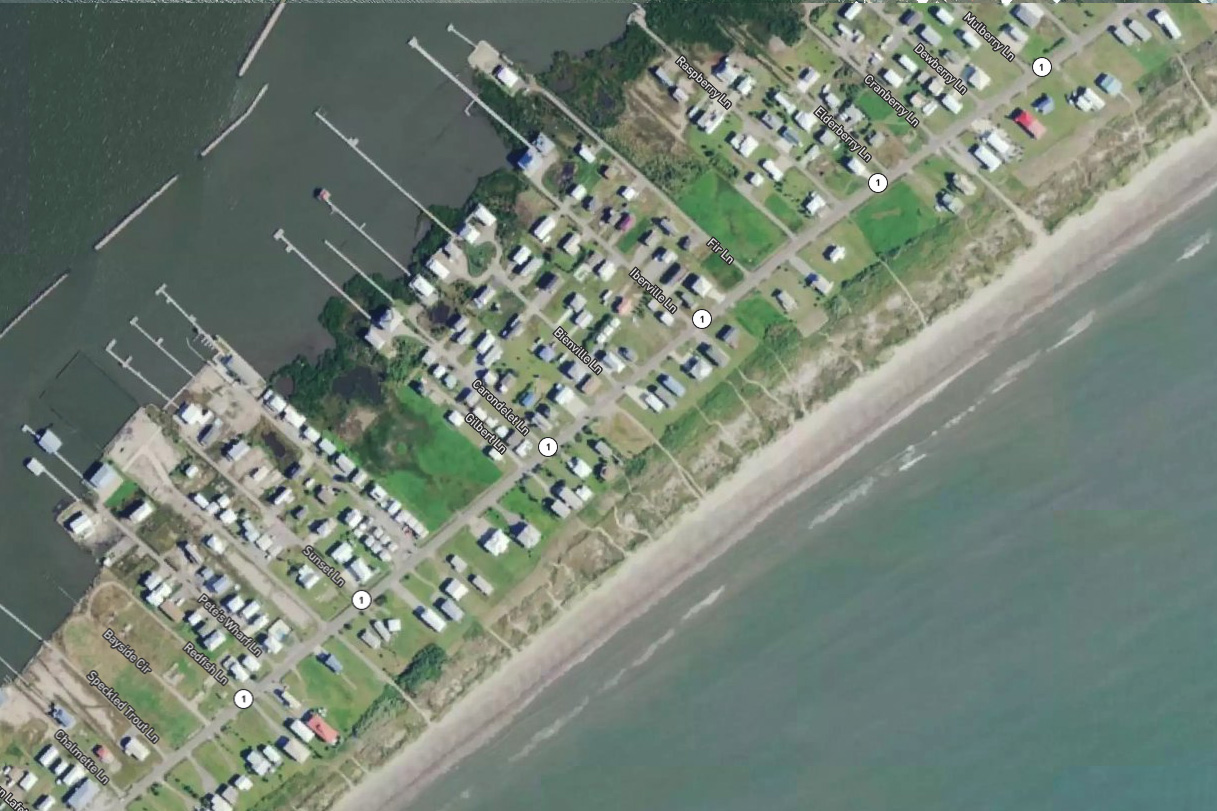
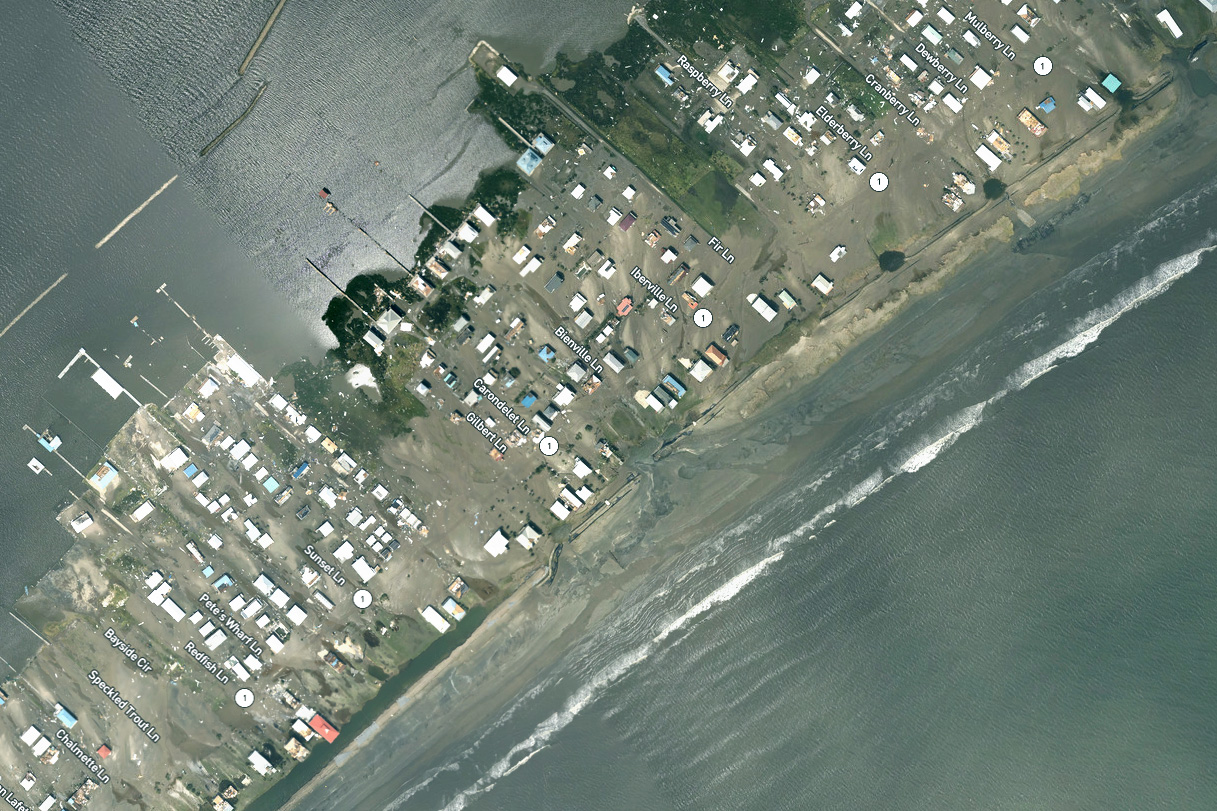
Click and drag slider to compare images of southwestern Grand Isle, Louisiana, in the Gulf of Mexico before (left) and after (right) the passage of Hurricane Ida in late August 2021. Explore more images from the NOAA Remote Sensing Division.
As the remnants of Ida moved into the Northeast it merged with a second weather system, creating severe weather and flash flooding across a wide region from eastern Pennsylvania to New York. Flash flood emergencies were declared in New Jersey and New York for the first time. The floods caused dozens of fatalities, and damaged homes, businesses, vehicles, and infrastructure. 2021 was the fifth consecutive year (2017-2021) that the U.S. has been impacted by a slow-moving tropical cyclone that produced extreme rainfall and damaging floods: Harvey, Florence, Imelda, Sally, and Ida.
Historic Cold Wave / Winter Storm (February 2021): $24.0 billion, 226 deaths
An historic cold wave and winter storm impacted many northwest, central, and eastern states in February 2021. Temperature departures exceeding 40.0 degrees F (22.2 degrees C) below normal occurred from Nebraska southward to Texas. The prolonged Arctic air caused widespread power outages in Texas, as well as other southern states, with multiple days of sustained below-freezing temperatures. At the peak of the outage, nearly 10 million people were without power. Additional impacts were frozen water pipes, which burst upon thawing causing water damage to buildings.
These extreme conditions also caused or contributed to the direct and indirect deaths of more than 210 people in Texas alone. There were also snow and ice impacts across numerous states including Oklahoma, Arkansas, Missouri, Illinois, Kentucky, Tennessee, Louisiana, Mississippi, Colorado, Oregon, and Washington. The February event is now the costliest U.S. winter storm event on record, more than doubling the inflation-adjusted cost of the 'Storm of the Century' that occurred in March 1993.
Western Wildfire Season (2021): $10.6 billion, 8 deaths
Severe drought conditions and periods of extreme heat provided conditions favorable for another demanding western wildfire season, most focused across California, Oregon, Washington, Idaho, and Montana. The Dixie Fire consumed over 960,000 acres making it the second-largest wildfire on record in California, while also destroying more than 1,000 structures. California's Caldor Fire grew rapidly during August, threatening South Lake Tahoe communities and burned over 220,000 acres.
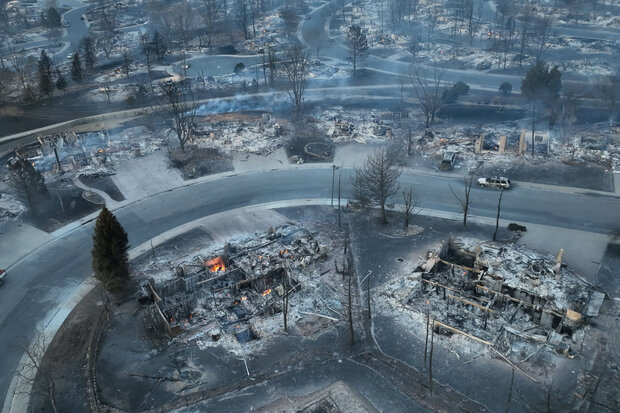
The Marshall Fire left smoldering ruins in a Louisville, Colorado, neighborhood, at the end of December 2021. Photo courtesy WXChasing. Used with permission.
Other large wildfires include the Ford Corkscrew Fire (Washington), the Bootleg Fire (Oregon), the Boundary Fire (Idaho), the Trail Creek Fire (Montana) and the Telegraph Fire (Arizona), among many others. There was also the Marshall Fire in Boulder County, Colorado on December 30 that damaged or destroyed more than 1,000 homes and businesses. This wildfire is the most destructive on record in Colorado. Throughout the wildfire season, air quality was also a concern across numerous states, as ash and fine particulates from many wildfires hid the skies and made outdoor activities more hazardous. Over 7.1 million acres have burned nationally during the 2021 wildfire season.
Historic Heat Wave (June-July 2021) and Persistent Western Drought: $8.9 billion, 229 deaths
Western drought conditions were persistent throughout 2021, as the drought expanded and intensified across many Western states. A historic heat wave also developed for many days across the Pacific Northwest shattering numerous all-time high temperature records across the region. This prolonged heat dome was maximized over the states of Oregon and Washington and extended well into Canada.
Daytime high temperatures across the western United States on June 23-28, 2021, according to data from NOAA's Real-Time Mesoscale Analysis/URMA. Climate.gov animation based on NOAA URMA data.
These extreme temperatures impacted several major cities and millions of people. For example, Portland reached a high of 116 degrees F while Seattle reached 108 degrees F. These extreme temperatures caused hundreds of direct and indirect heat-related fatalities across Oregon and Washington. This combined drought and heat rapidly dried out vegetation across the West, impacting agriculture. Low water levels also forced the hydroelectric power plant at Lake Oroville in California to shut down for the first time since it opened in 1967.
1980-2021 costs and fatalities by disaster type
The distribution of damage from U.S. billion-dollar disaster events from 1980 to 2021 is dominated by tropical cyclone losses. Tropical cyclones have caused the most damage ($1,148.0 billion) and have the highest average event cost ($20.5 billion per event). Drought ($285.4 billion), severe storms ($330.7 billion), and inland flooding ($164.2 billion) have also caused considerable damage based on the list of billion-dollar events.
Severe storms have caused the highest number of billion-dollar disaster events (143), but they have the lowest average event cost ($2.3 billion). Tropical cyclones and flooding represent the second and third most frequent event types (56 and 35), respectively. Tropical cyclones are responsible for the highest number of deaths (6,697), followed by drought/heatwave events (4,139) and severe storms (1,880).
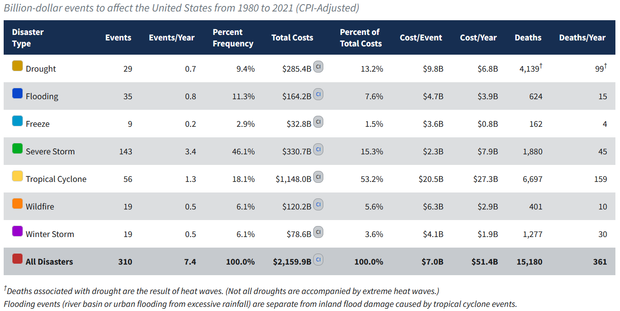
This table shows the breakdown, by hazard type, of the 310 billion-dollar weather and climate disasters assessed since 1980. Screenshot from the NOAA NCEI Billion-dollar Disasters webpage.
Climatology of billion-dollar disasters
Disasters by region
The South, Central and Southeast regions of the U.S., including the Caribbean U.S. territories, have suffered the highest cumulative damage costs, reflecting the severity and widespread vulnerability of those regions to a variety of weather and climate events. In addition to the highest number of billion-dollar disasters experienced, Texas also leads the U.S. in total cumulative costs (~$343 billion) from billion-dollar disasters since 1980. Florida is the third-leading state in total costs since 1980 (~$248 billion), largely the result of destructive hurricane impacts.
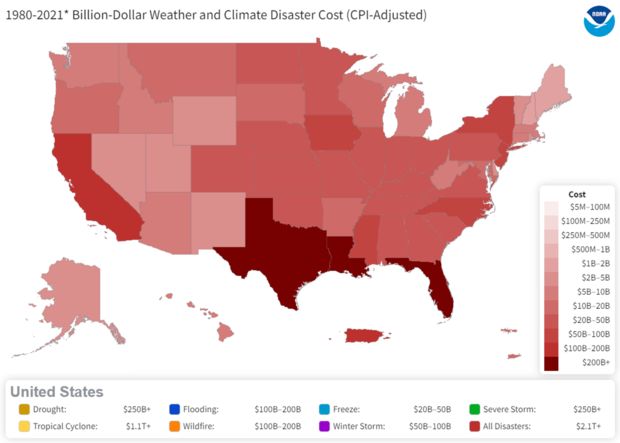
This map depicts the total estimated cost borne by each state from billion-dollar weather and climate events from 1980-2021.
Louisiana’s total costs passed Florida’s in 2021 and are now the 2nd highest total costs (~$270 billion) from billion-dollar disasters–eclipsing Florida this year with the impacts from Ida. Louisiana, like Texas, also suffers from a high frequency of disaster events, which often leads to a compounding, cascading series of socioeconomic impacts. 2021 is no exception as Louisiana was impacted by another category 4 hurricane (Ida) one year after category 4 Hurricane Laura. Louisiana also continues to recover from several different tropical cyclones that caused widespread damage during the 2020 hurricane season. It is also important to note that Louisiana has a much smaller population and economy than either Texas or Florida. Therefore, the relative cost and impact from extremes in Louisiana are more severe and recovery is more difficult.
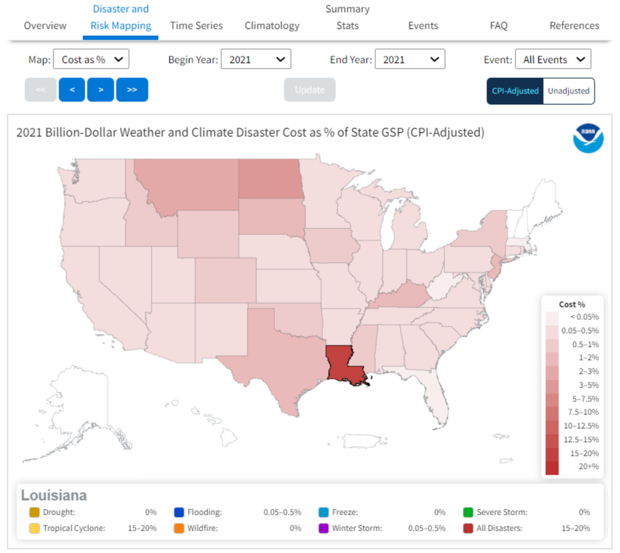
Screenshot of a map the US showing billion-dollar disasters costs as a percentage of each state's gross domestic product (GDP) over the historical record from 1980-2021.
Another way to examine damage is to compare each state’s annual disaster losses relative to their Gross State Product (GSP), which represents economic output. The damage costs from Hurricane Ida across Louisiana were impactful during 2021 reflecting 15-20% of Louisiana’s 2021 economic output (GSP). Several other states across the Nation also sustained relatively large hazard impacts from other extremes including drought, wildfire, flooding and tornadoes.
Billion-dollar disasters by month
The 42-year climatology of U.S. billion-dollar disasters offers a view of risk from extreme events, which are often seasonal in nature. For example, during the spring months (March-May) severe storms including tornadoes, hail, and high winds often occur in many Central and Southeast states. During the spring months there is also potential for major river flooding (i.e., deep blue events in chart above). U.S. springtime flooding from snowmelt and/or heavy rainfall is a persistent hazard that affects many towns and agriculture regions within the Missouri and Mississippi River basins, among others.
During the fall season, Gulf and Atlantic coast states must be vigilant about hurricane season particularly during August and September (i.e., yellow events in chart above). Hurricanes are the most destructive and costly of these events totaling damage losses exceeding $1 trillion since 1980. For example, in 2016-2018, the U.S. was impacted by 6 separate billion-dollar hurricanes (i.e., Matthew, Harvey, Irma, Maria, Florence, Michael) with 3,318 fatalities and an inflation-adjusted loss total of $365.1 billion. As a comparison, the U.S. also experienced a series of active hurricane seasons from 2003-2005 where 9 separate billion-dollar hurricanes (e.g., Charley, Ivan, Katrina, Rita, Wilma, etc.) made landfall, with 2,225 fatalities and an inflation-adjusted loss total of $329.9 billion.
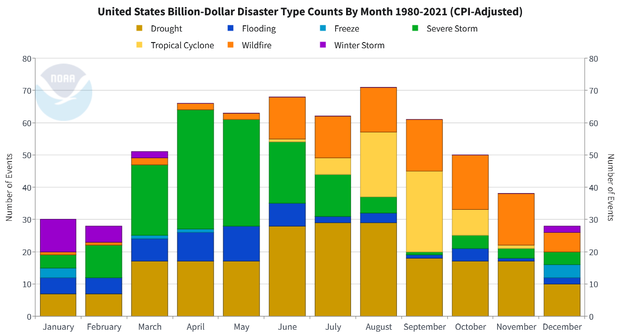
The monthly climatology of U.S. billion-dollar weather and climate disasters from 1980 to 2021, showing which months have the greater frequency of disasters (height of bar) and which types of events (colors) are most likely to occur in a given month. NOAA NCEI
Also, the peak of the Western U.S. wildfire season occurs during the fall months of September, October and November (i.e., orange events in chart above). California, Oregon, Washington, Idaho, Montana and Colorado often experience enhanced wildfire risk and related poor air quality for weeks to months. Western wildfire risk is also becoming more hazardous, as 17 of the 20 largest California wildfires by acreage and 18 of the 20 most destructive wildfires by # of buildings destroyed have occurred since the year 2000. In four of the last five years (2017, 2018, 2020 and 2021) California has experienced historically large and costly wildfires with losses well exceeding $50.0 billion.
In total, each region of the U.S. faces a unique combination of recurring hazards, as billion-dollar disaster events have affected every state since 1980. The chart above highlights how the frequency of billion-dollar disasters differs across both time and space. The combined historical risk of U.S. severe storms and river flooding events places the spring and summer seasons in the high-risk category for simultaneous extreme weather and climate events. Hurricane, wildfire and drought impacts dominate the Fall season. The Winter months are also sometimes active with the potential for many types of extreme events and impacts, as we saw in 2021.
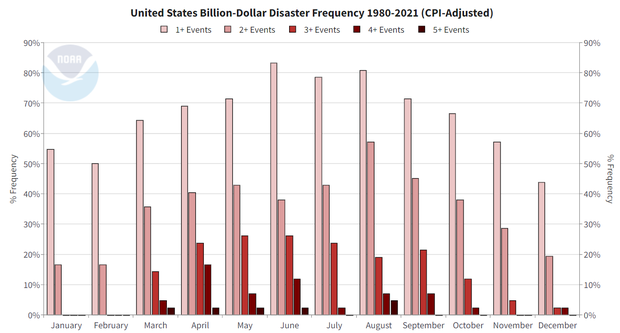
Billion-dollar weather and climate disasters occur in all months, but the spring and summer (March–Aug) are the time when multiple, concurrent disasters are likely. A second maximum occurs in the Fall driving by tropical cyclones. Screenshot from the NCEI Billion-dollar Disasters webpage.
The increase in disasters create 'compound extremes' (e.g., billion-dollar disaster events that occur at the same time or in sequence), which are also an increasing problem for recovery. As noted in National Climate Assessment (2017) "the physical and socioeconomic impacts of compound extreme events (such as simultaneous heat and drought, wildfires associated with hot and dry conditions, or flooding associated with high precipitation on top of snow or waterlogged ground) can be greater than the sum of the parts." For example, in 2021 California experienced drought-enhanced wildfire seasons that produced wildfires and mountain-side burn scars, followed by atmospheric rivers of heavy rainfall that enhanced landslides and flooding.
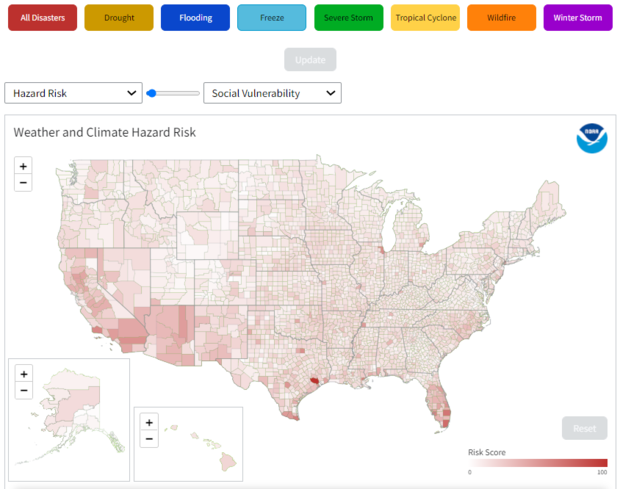
Mapping County Level Hazard Risk, Vulnerability, and Projected Future Impacts
To better reflect multi-hazard risk – the Billion-dollar disaster site now provides a mapping tool that provides county-level information on natural disaster hazards across the United States. This interactive NOAA mapping tool provides detailed information on a location’s susceptibility to weather and climate hazards that can lead to billion-dollar disasters—such as wildfires, floods, drought and heat waves, tornado outbreaks, and hurricanes. The tool expands upon FEMA’s National Risk Index to provide a view of a location’s risk for, and vulnerability to, single or multiple combinations of weather and climate hazards for every county and county-equivalent in all 50 states, and the District of Columbia: https://www.ncdc.noaa.gov/billions/mapping
Screenshot of the new billion-dollar disaster mapping tool from NCEI that allows users to see past and projected future risk of economic damages from disasters if the world follows an energy pathway with high greenhouse gas emissions.
This mapping tool is intended to provide U.S. communities with information and guidance on their susceptibility to weather and climate hazards, as well as potential future impacts from them. For future perspective, these maps provide median values—the middle value from multiple model experiments—for projected economic impacts by 2080–2099 if the global economy continues to follow a pathway of high greenhouse gas emissions (RCP 8.5).
Impacts are changes relative to counterfactual 'no additional climate change' trajectories and include: percent change in yields (area-weighted average) for corn, wheat, soybeans, and cotton; change in all-cause mortality rates across all age groups; change in electricity demand; change in labor supply of full-time-equivalent workers for high-risk jobs where workers are heavily exposed to outdoor temperatures; change in damages from coastal storms; and median total direct economic damage across all sectors.
(Source: Hsiang, S., Kopp, R.E., Jina, A., Rising, J., Delgado M., Mohan, S., Rasmussen, D.J., Muir-Wood, R., Wilson, P., Oppenheimer, M., Larsen, K., and T. Houser. 2017. Estimating economic damage from climate change in the United States. Science, 356, 1362-1369. doi:10.1126/science.aal4369.)
This tool could assist with enhancing hazard preparation and mitigation for homeowners, community planners and emergency managers; encouraging community-level risk communication and planning; guiding communities' building codes and standards; and informing disaster resilience and recovery plans in the long term. This mapping tool gives broad, nationwide comparisons reflecting a county's combined physical exposure, vulnerability, and resilience to hazard risks.
In 2022, NCEI will continue to incorporate new layers and filters that offer added flexibility to the online tools for additional context and analysis. For additional context on data sources, methods, metrics, caveats and reports see: https://www.ncdc.noaa.gov/billions/references
Comments
Data
Why does the data start in 1980? 42 years is a really short timeframe to infer trends. Usually, when a short timeframe is used in data like this, it is because the starting date is specifically chosen to push a narrative that won't show the same trend if a longer timeframe is used. To be fair, at least there was a mention that all of the increases in storm damage weren't solely due to climate:
"The increase in population and material wealth over the last several decades, are an important cause for the rising costs."
It does seem like a big portion of the billion-dollar events could have been avoided.
"In four of the last five years (2017, 2018, 2020 and 2021) California has experienced historically large and costly wildfires with losses well exceeding $50.0 billion."
That may be true, but wildfires are mostly started by humans, and they are large and costly at least partially because they have neglected to do controlled burns and because more people are living in those forests. Plus, those excessive fires destroy large areas of vegetation, which leads to increased flooding.
Also, the Texas power grid failure happened because of poor planning and bad decisions, not just because it was an unusually severe storm.
I do agree with this statement: "Given all these compounding hazard risks, there is an increased need to focus on where we build, how we build, and investing in infrastructure updates that are designed for a 21st century climate". In my opinion, we have a much better chance of making those improvements than we do of trying to prevent the climate from changing.
It would be interesting for someone to use the same available data and make a case that storms and storm damage are not getting much worse, just like debate competitions where participants have to be able to argue both sides of the topic.
A few quick responses: This…
A few quick responses:
Well designed article!
Just dropping by to tell you how much I appreciate you creating this article and showing the data on graphs. Your work is appreciated. -Emergency Management major
Comments have been disabled on this article