With El Niño likely, what climate impacts are favored for this summer?
In the recent ENSO Diagnostic Discussion, the probability of El Niño during this Northern Hemisphere summer (June to August) exceeds 90%. As of late May, weak to moderate El Niño conditions are already here, both in the oceanic and atmospheric aspects. And many ENSO prediction models are calling for the sea surface temperature (SST) anomalies to increase during the next several months.
Usually, El Niño or La Niña episodes attain peak strength in autumn or early winter (1), and climate impacts in the mainland US are most reliable during winter—just a bit later than peak time. Last June, Mike Halpert described the expected effects of El Niño in the US during winter. But because the Nino3.4 SST anomaly was only at a borderline-to-weak El Niño level, and the tropical Pacific atmospheric responses were weak-to-nonexistent, the wintertime precipitation pattern frequently seen in the US during El Niño did not materialize. Now we have another shot at El Niño for winter 2015-16.
But winter is a long way off. What about impacts of El Niño over the average of the coming 3 summer months? What are the expected effects, and are these expectations incorporated into current climate forecasts? The short answer is that the effects of El Niño are mostly weak or insignificant in the US during summer. However, they are substantial and more consistent in other parts of the globe. Let’s check out the global response first, and then return to the US.
Global El Niño Impacts during June-August
The climate effects of El Niño are always strongest in the tropics, but tend to be stronger in the hemisphere having its winter, which is now the Southern Hemisphere (2). (Note, for example, what the Aussies are saying right now about the current El Niño.) The typical climate effects of El Niño during June-August are shown in a general, broad brushed manner in the following schematic map.
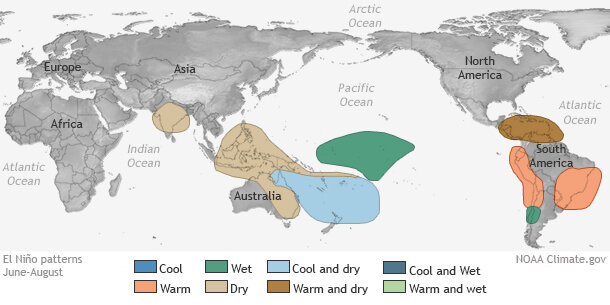
Temperature and precipitation patterns that are typical of summertime El Niño conditions. Map by NOAA Climate.gov, based on originals from the Climate Prediction Center.
More detailed descriptions of the effect of El Niño on the global climate are provided by maps made at CPC, showing how closely the fluctuations in summer rainfall and temperature match fluctuations in the tropical Pacific Nino3.4 SST. These maps show correlation coefficients (3) between the Nino3.4 SST and rainfall and temperature over the globe for each 3-month season. The maps of correlation for June-August are shown in the figure below.
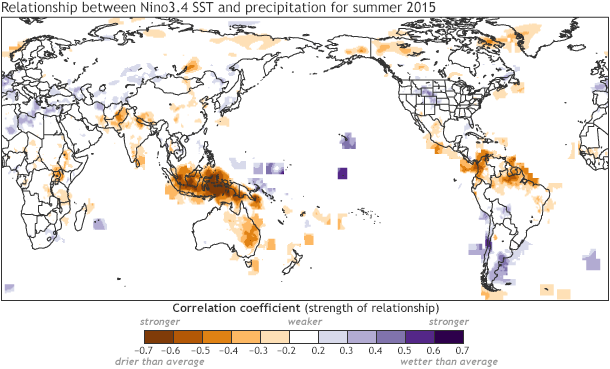
Correlation between the sea surface temperature in the Nino3.4 region in the central tropical Pacific ocean (indicating El Niño when above average) and precipitation over the globe. Negative (brown) areas indicate less rainfall during El Niño. Correlation values between -0.25 and 0.25 are considered statistically nonsignificant; they could have occurred by chance and therefore should be considered with caution. Map by Climate.gov, based on Climate Prediction Center data.
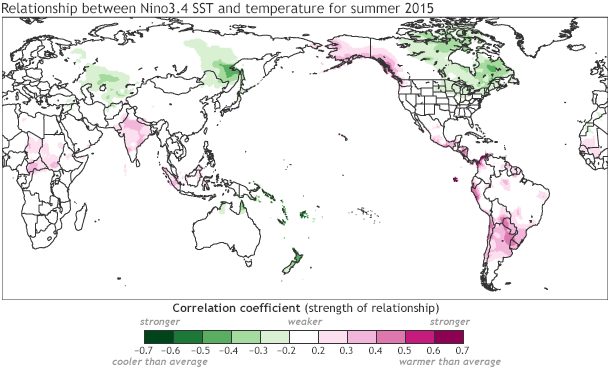
Correlation between the sea surface temperature in the Nino3.4 region in the central tropical Pacific ocean (indicating El Niño when above average) and temperature over the globe. Positive (dark pink) areas indicate higher temperature during El Niño. Correlation values between -0.25 and 0.25 are considered statistically nonsignificant; they could have occurred by chance and therefore should be considered with caution. Map by Climate.gov, based on Climate Prediction Center data.
During the June-August season, there is a strong tendency for below average rainfall in Indonesia and parts of northern South America. The same tendency is found, but not as strongly, in eastern Australia, Central America (west of the Divide), the eastern Caribbean, India and some closely surrounding countries, and the Sahel of western Africa. Central Chile tends to be wetter than average, as does southeastern South America (e.g., eastern Argentina). Below average temperature is likely to occur with El Niño during June-August in much of eastern Canada, while warmer than average is likely in India, Northern Africa, southeastern and northwestern South America, Central America, and the Pacific coastal region of northwest North America.
El Niño Impacts in the US
Although the effects of El Niño in the US are weak during summer, Ropelewski and Halpert (1987) found a tendency toward above-normal rainfall in a small region centered on Utah, and Mason and Goddard (2001) indicated a wet signal around Colorado and Wyoming. More recently, the correlation maps and also El Niño composites suggest weakly enhanced rainfall over small areas scattered east of the Great Basin (Wyoming, Colorado, and Nebraska). But this weak wet tendency does not show up in a very similar pattern in adjacent seasons (May to July, or July to September), indicating that it may not be a statistically robust signal over the longer historical record (5). Or, it may be real but quite weak, rendering it unreliable.
Because the effects of El Niño are weak in the US in summer, they do not have a gangbuster influence on the NOAA Climate Prediction Center’s seasonal forecasts, as seen below in their latest outlooks for June-August 2015 precipitation and temperature.
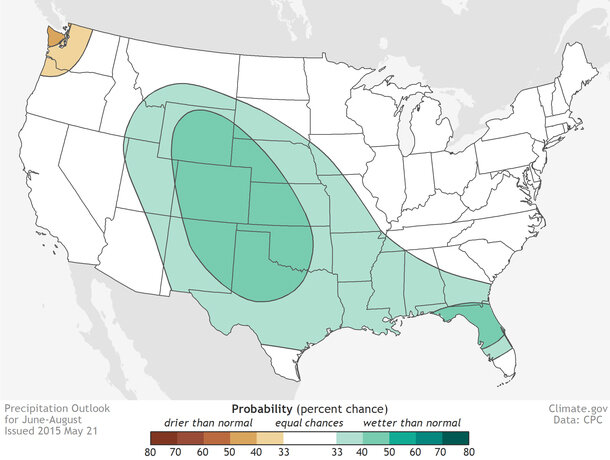
The NOAA/Climate Prediction Center outlook for seasonal total precipitation for June-August 2015 issued in the third week of May. Green areas indicate places with an increased chance for above normal rainfall, while brown areas show an increased chance for below normal rainfall. “Normal” is defined by the rainfall that was observed in middle one-third of the cases during the 30-year period of 1981-2010. The numbers show the probability for above-normal (if green) or below normal (if brown) rainfall. White areas indicate no forecast direction, and an equal (33.3%) probability for any of the three possibilities (below normal, near normal or above normal). Maps by Hunter Allen, based on CPC data.
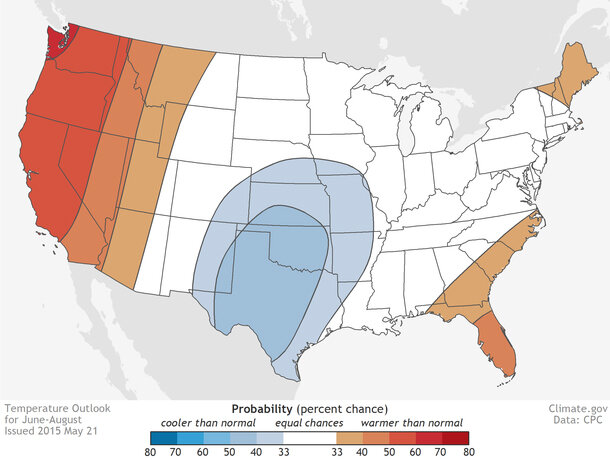
The NOAA/Climate Prediction Center outlook for seasonal average temperature for June-August 2015 issued in the third week of May. Red areas indicate places with an increased chance for above-normal temperature, while blue areas show an increased chance for below normal temperature. “Normal” is defined by the temperature that was observed in middle one-third of the cases during the 30-year period of 1981-2010. The numbers show the probability for above-normal (if red) or below normal (if blue) temperature. White areas indicate no forecast direction, and an equal (33.3%) probability for any of the three possibilities (below normal, near normal or above normal). Maps by Hunter Allen, based on CPC data.
A slightly elevated probability for above-average rainfall is forecast in a large area covering most of the Plains, the central and southern Rockies, and much of the Southeast.
Forecasters believe that those areas will most likely be wet partly due to the weak influence of the expected El Niño, but perhaps more strongly because of the consensus of forecasts of the North American Multi-Model Ensemble (NMME) (6), which is a suite of today’s most advanced coupled ocean-atmospheric dynamical models.
The temperature outlook does not particularly resemble the expected El Niño impact, as long-term trends (mainly toward warmer conditions) may easily outweigh the ENSO effects during summer. So, while El Niño is the 800-pound gorilla in winter forecasts in the US, it is more like a tame, 6-pound Chihuahua in summer, as it is joined with, or preempted by, other considerations going into CPC’s seasonal outlook (O’Lenic et al 2008).
However, the El Niño is more clearly affecting the global climate forecasts. The IRI’s global seasonal outlook for June-August is shown below for precipitation and temperature.
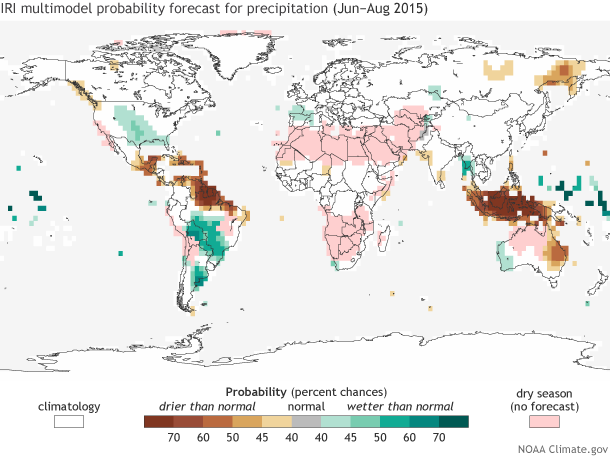
The IRI outlook for seasonal total precipitation for June-August 2015 issued in the third week of May. Green areas indicate places with an increased chance for above normal rainfall, while yellow or brown areas show an increased chance for below normal rainfall. “Normal” is defined by the rainfall that was observed in middle one-third of the cases during the 30-year period of 1981-2010. The color shading shows the probability for above-normal (if green) or below normal (if yellow or brown) rainfall. White areas indicate no forecast direction, which implies an equal (33.3%) probability for any of the three possibilities (below normal, near normal or above normal). Pink indicates regions having their climatological dry season (less than 30 mm during the season). Map by Fiona Martin, based on IRI data.
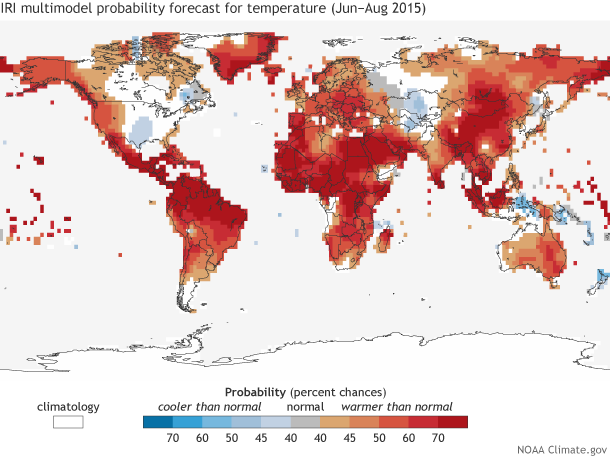
The IRI outlook for seasonal average temperature for June-August 2015 issued in the third week of May. Red areas indicate places with an increased chance for above normal temperature, while blue areas show an increased chance for below normal temperature. “Normal” is defined by the temperatue that was observed in middle one-third of the cases during the 30-year period of 1981-2010. The color shading shows the probability for above-normal (if red) or below normal (if blue) temperature. White areas indicate no forecast direction, which implies an equal (33.3%) probability for any of the three possibilities (below normal, near normal or above normal). Map by Fiona Martin, based on IRI data.
These outlooks incorporate the Climate Prediction Center’s outlooks over the US, but use IRI’s own models for the forecasts over the rest of the globe.
The tendency for below-average precipitation over Indonesia and northern South America and above-average precipitation over south-central South America and many of the tropical Pacific islands resembles the expected El Niño influence shown in the top figure above. An influence from El Niño in the temperature forecast is difficult to discern, because global warming trends, among other influences unique to this particular year, may outweigh ENSO’s influence.
So the bottom line here is that if we have a moderate or strong El Niño, it won’t matter a whole lot in the US during summer, as El Niño is combined with or preempted by other influences that change from one year to another whether El Niño is occurring or not. Meanwhile, it will have fairly predictable climate impacts elsewhere around the globe (Ropelewski and Halpert 1987, 1996; Halpert and Ropelewski 1992). In the past, these impacts have lead to major forest fires in Indonesia that created dangerously unhealthy air, drought in northern Brazil that triggered water shortages and consequent political unrest, and massive fish kills from the warmed waters along the coast of Peru and Ecuador that had devastating economic consequences.
But wait until the coming winter, and then hold on to your hat! Significant El Niño conditions that exist during summer often hang around, and even strengthen, going into fall and at least the first half of winter. Take a look at the climate anomalies that the US experienced during some of the past El Niño winters that we may look forward to in 6 months.
Footnotes
(1) Because of the typical seasonal cycle of ENSO episodes, with onset in late spring or summer followed by peak strength between October and January and dissipation during the following February to May, a strong El Niño (or La Niña) is atypical during summer. Since 1950, only one case of a strong El Niño (sea surface temperature of at least 1.5°C above normal) has been observed during June-August (in 1997), and 4 cases of moderate strength (1° to 1.5°C above normal) have occurred (1957, 1965, 1972, and 1987). Four cases of moderate La Niña have occurred since 1950 (1973, 1975, 1988, and 1999). Typically, ENSO events become stronger in fall and early winter than in summer.
(2) The effects of El Niño (or La Niña) are greater for the hemisphere having winter because, firstly, that is the hemisphere that has a better defined Hadley circulation, which is a north-south oriented overturning cell that transports tropical air away from the equator in the upper atmosphere, and returns air from outside the tropics back toward the equator at lower levels in the atmosphere. In the hemisphere having summer, the difference in temperature between the tropics and outside the tropics is much less than it is in the hemisphere having winter, and this temperature difference is one important cause of the Hadley circulation. The Hadley circulation is enhanced during El Niño because there is more heating associated with the greater cloudiness and rainfall that comes with the warmed ocean surface waters. With a weaker Hadley circulation during summer, there is less for the El Niño to act on to produce the climate impacts (the teleconnections) away from the tropics. A second, somewhat related, reason for weaker effects in the hemisphere having its summer is that the large-scale circulation patterns at middle latitudes (such as those of the US) are weaker and have shorter distance scales than in the hemisphere having winter.
(3) The correlation coefficient shows how strongly two variables are related. When the coefficient is +1, one variable is perfectly related to the other (but may not equal it numerically). When it is -1, the two variables are also perfectly related, but change exactly oppositely from one another. When it is 0, the variables are unrelated and change in a random fashion with respect to one another. Here, one of the variables is the Nino3.4 SST, and the other is the temperature or the amount of precipitation. The maps show the geographical distribution across the globe of the correlation between Nino3.4 SST and the temperature or the rainfall.
(4) The maps shown in the figure show results only over land areas, so the knowledge about effects over ocean areas come from data of outgoing longwave radiation (OLR) from satellites, which are used as substitutes for ground-level rainfall measurements.
(5) Also, L'Heureux et al. (2015) shows that El Niño’s effect on North America precipitation in summer is not field significant. This means that although there are a few specific locations having local statistical significance (i.e., the probability that it occurred by chance is low, such as less than 5%), the chance of obtaining this extent of local significance across the whole tested domain by chance is not so low, considering the large number of opportunities to get local significance, even though each one considered alone has a low probability. Remember that getting local significance can happen by chance (although it is unlikely), but having it happen at least a few times over a large domain by chance is not so low. Obtaining field significance, by having more than just a few isolated instances of local significance, lends credibility to those instances of local significance. Often, without field significance, instances of local significance are discounted, unless one has physical reasons to back them up.
(6) Of course, the NMME may be forecasting wet conditions in the Plains and Rockies at least in part because of the influence of the El Niño, along with other factors unrelated to the El Niño. A good climate model should be able to incorporate all influences, along with their linear and/or nonlinear interactions.
References
L’Heureux, M. L., M. K. Tippett and A. G. Barnston, 2015: Characterizing ENSO coupled variability and its impact on North American seasonal precipitation and temperature. J. Climate, 28, 4231-4245.
Mason, S. J., and L. Goddard, 2001: Probabilistic precipitatin anomalies associated with ENSO. Bull. Amer. Meteor. Soc., 82, 619-638.
O’Lenic, E. A., D. A. Unger, M. S. Halpert, and K. S. Pelman, 2008: Developments in operational long-range climate prediction at CPC. Wea. Forecasting, 23, 496-515.
Halpert, M. S. and C. F. Ropelewski, 1992: Surface temperature patterns associated with the Southern Oscillation. J. Climate, 5, 577-593.
Ropelewski, C. F., and M. S. Halpert, 1987: global and regional scale precipitation patterns associated with the El Niño/Southern Oscillation. Mon. Wea. Rev., 115, 1606-1626.
Ropelewski, C. F., and M. S. Halpert, 1996: Quantifying Southern Oscillation-Precipitation relationships. J. Climate, 9, 1043-1059.
Comments
Temp variation maps with rainfall labelling?
One last fix -- US temp map
RE: One last fix -- US temp map
Thanks! We needed you as a copy editor last night as we were scrambling to get this posted! All the captions should (should!) be updated now with the correct variable.
Nino accelerate Dora Madden Julian
RE: Nino accelerate Dora Madden Julian
It is not entirely clear how the MJO and ENSO interact. This is in part because it is sometimes difficult to isolate the influence of MJO versus the influence of ENSO. They can definitely coexist with each other, which can amplify or suppress tropical and global impacts. So far this year, we have seen very little MJO activity. While I don't know the reference off the top of my head, I have heard some folks speculate that MJO activity is reduced during stronger El Nino and La NIna periods.
El nino effects on spring pattern to date
RE: El nino effects on spring pattern to date
It is likely we have seen some El Nino-like impacts since El Nino was declared in March 2015. This would need further inspection, but our historical analysis shows that we tend to see increased springtime rainfall across parts of the southern tier of the United States during El Nino. Specifically, we see these signals over Texas and the Gulf Coast states. However, the historical El Nino relationship over the southwestern U.S. appears very weak or insignificant, so other culprits may be at play.
Wondering if...
RE: Wondering if...
California tends to get above average winter rainfall mainly during "moderate-plus" or strong El Nino events. Southern California is more likely to get this rainfall surplus than northern California, but in the very strongest events all of the state is likely to get it. But not all moderate events bring such rains. Note that 1986-87, 1987-88, and 1963-64 did not, and 1991-92 (a fairly strong event) only gave good rains to southernmost California. It's really impossible to predict when much of the California coast will get soaked. And this year, we still don't know for sure whether the event will be strong (>1.5C above average for at least one 3-month period in Nino3.4 region) or only high moderate. It currently looks promising, with last week's average (using OISST, not the official ERSSTv4) up to 1.4. As for summer effects, we are even less sure of any effect in California, and see little evidence of anything systematic. I don't often deal with data prior to 1950, so can't quicklly check out the eastern Pacific tropical cyclone behavior in the late 1930s that you speak of. I do hope something will break the drought in the western US, and California in particular could benefit from the El Nino, especially in the later part of the winter (Jan to Mar).
Great Stuff
Distribution List
RE: Distribution List
Thanks for the good feedback on this. To learn of upcoming blog articles, check the overall ENSO blog page to see all articles, beginning with the most recent one: http://www.climate.gov/news-features/department/8443/all
There should be a new article approximately once every couple of weeks.
Also, you can be notified of new material through one of the following routes:
Via RSS: http://www.climate.gov/news-features/feed.xml
Via Twitter: @NOAAClimate
Via Facebook: https://www.facebook.com/NOAAClimateGov
Thanks again for the nice compliment!
el nino 2015-2016 winter
RE: el nino 2015-2016 winter
An increased chance for above normal rainfall. See the Climate Prediction Center's forecast maps at the site: http://www.cpc.ncep.noaa.gov/products/predictions/multi_season/13_seaso…
Comments have been disabled on this article