A visit to the zoo: climate patterns that can precede ENSO
Here at the ENSO Blog, we talk about a lot of different climate patterns, not just the El Niño-Southern Oscillation (ENSO!) pattern. We’re named after ENSO because that’s the 800-pound gorilla, the most influential seasonal climate phenomenon so far identified—check out the FAQ for a lot more info on ENSO. But the global ocean/atmosphere system features many other, smaller gorillas, and some chimpanzees, lemurs, koalas, lions, and a platypus or two. (These are definitely not technical categories, although I might dedicate the rest of my career to making them so.)
Some of those other animals climate patterns, such as the Madden-Julian Oscillation, are carefully monitored because they’re known to affect weather and climate around the world. Others can give us an early glimpse into how ENSO might develop, such as the Pacific Meridional Mode or the South Pacific Oscillation. It’s this second collection of patterns, called ENSO precursors, that I’m going to dig into today.
Animation showing seven ENSO precursor patterns. Shaded colors show sea surface temperature (reds = warmer than average, blues = cooler), green lines show sea level pressure (solid = stronger than average, dotted = weaker), arrows show wind direction, and blue lines show wind stress, the force exerted on the water surface by the wind (solid = more than average, dotted = less). Figure by Kathy Pegion, animation by climate.gov.
The tiger’s stripes
Around the tropics, climate patterns can be identified in several different ways. They can include changes in the ocean surface temperature and/or some change in the atmospheric circulation. Atmospheric circulation changes can be detected in air pressure, wind direction/strength, rainfall, and other indicators. Many are called “oscillations,” which in weather and climate science means a see-saw between two locations—also called a dipole—on an irregular time interval (1).
Dozens, probably hundreds, of scientific papers have been written about identifying ENSO precursor patterns, how they might affect ENSO, and how they interact with each other. And, of course, the complexity of the ocean/atmosphere system is such that all these patterns are entangled, with interactions that we are only just beginning to understand. Add climate change on top—suffice to say, this post is just scratching the surface!
The chicken or the egg?
Since this topic is complicated enough, I’m just going to talk about how precursors influence the development of El Niño, and leave La Niña for another time. In general, precursor patterns affect the development of El Niño by changing the trade winds. These winds usually blow steadily from east to west across the equatorial Pacific, pushing warmer water into the western Pacific and leaving a relatively cooler region in the eastern Pacific as water is drawn up from the deeper ocean.
When the trades relax, the warm water in the far western Pacific can begin to move eastward under the surface, in the form of a downwelling Kelvin wave. Sometimes—but not always—when this warm water rises to the surface in the central/east Pacific, it can initiate the atmospheric response in the Walker circulation, which acts to reinforce the warm water, resulting in El Niño conditions. The idea behind tracking precursors is that, if we understand their behavior, we can add to our understanding of how El Niño events develop, both in terms of “will there be an El Niño next winter?” and “if so, what will it look like?”
Lots of animals around this watering hole
One precursor is the North Pacific Oscillation, which is a pattern of air pressure at sea level in the North Pacific Ocean. Specifically, the pressure in the far north (centered off the west coast of Alaska) is compared to the midlatitudes (draw a line between Tokyo and Santa Barbara). Most of the time during the winter, the air pressure is relatively high over this central region of the North Pacific, forming a subtropical high. When the air pressure here is lower than average, the winds along its southern edge—our old friends the trades—weaken. The North Pacific Oscillation is first and foremost an atmospheric pattern.
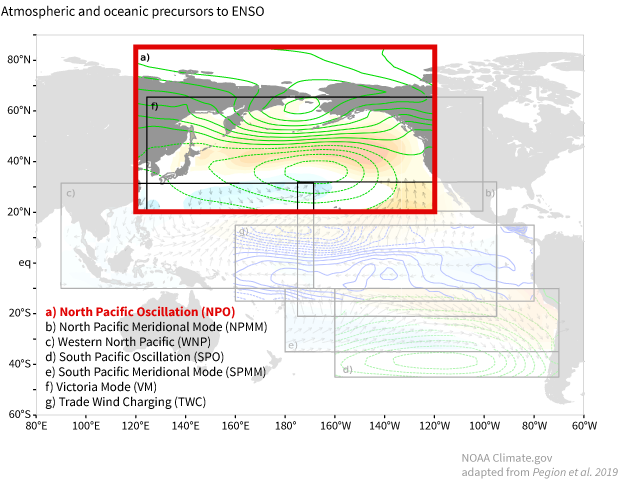
North Pacific Oscillation pattern in sea level pressure. Green solid lines show higher-than-average sea level pressure; dotted green lines show lower-than-average sea level pressure. Figure by climate.gov based on original by Kathy Pegion.
The North Pacific Oscillation (NPO) doesn’t act alone. Other precursor patterns help link the weakening of the subtropical high to the slowing of the trade winds. You may remember your brief fling with the Pacific Meridional Mode (re-branded for our purposes here as the North Pacific Meridional Mode). This pattern shows up in the eastern Pacific as warmer-than-average surface water north of the equator and cooler-than-average water south of the equator. The weaker trades of the NPO encourage the warmer ocean surface on the north side of the equator, which in turn helps to reinforce the weakening of the trades. For more on this complicated dance, check out Dan Vimont’s guest post.
The Victoria Mode and Trade Wind Charging also link the NPO to the equatorial region and thereby to ENSO development. The signature of the Victoria Mode is cooler-than-average surface water and related weaker trades in the western North Pacific (2). The cooler western Pacific signature of the Victoria Mode develops in tandem with the NPO circulation.
“Trade Wind Charging” is the mechanism linking the changes in trade winds to increased subsurface water temperature. Its signature is reduced wind stress—the force on the surface that is caused by the wind—in the eastern Pacific, and increased wind stress in the western Pacific. The changes in wind stress are what help to kick off downwelling Kelvin waves, which increase the subsurface temperature. This source of warmer water is necessary for a developing El Niño.
Not directly related to the NPO is the Western North Pacific pattern. The signature of this pattern is cooler-than-average water off the coast of China and warmer water in the central equatorial Pacific in the winter. This leads to slower trades and lower wind stress on the surface of the western equatorial Pacific, inducing downwelling Kelvin waves and increasing subsurface heat content. Research has found this pattern can precede the development of El Niño by a full year.
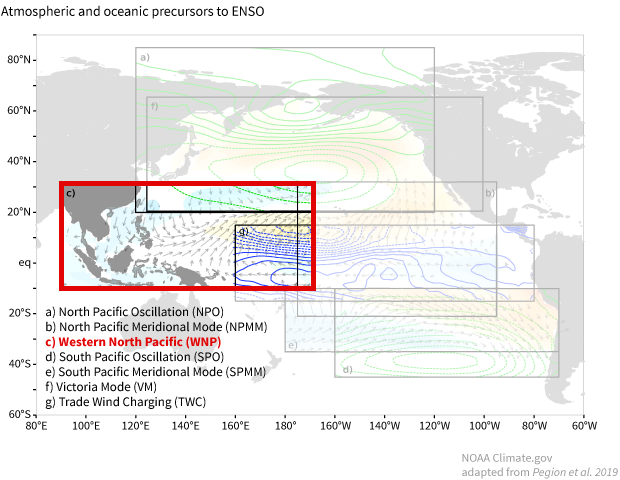
Western North Pacific pattern. Shaded colors show sea surface temperature (reds = warmer than average, blues = cooler) and arrows show wind direction. Figure by climate.gov based on original by Kathy Pegion.
In the Southern Hemisphere, we have the South Pacific Oscillation and the South Pacific Meridional Mode. (Hey, we can’t all have catchy names like The Blob.) Whereas the northern precursors I described above are most useful during December–February, the southern ones are most active during June–August, winter in the Southern Hemisphere. Like its North Pacific counterpart, the South Pacific Oscillation is a change in sea level pressure, leading to a reduction in the trade winds. And, also like its northern sibling, the South Pacific Meridional Mode appears as warmer-than-average water to the south of the equator, and helps to link the trade wind changes of the South Pacific Oscillation to the equatorial winds. For in-depth coverage of the southern modes (as well as a successful forecast!), head to Jason Furtado’s guest post.
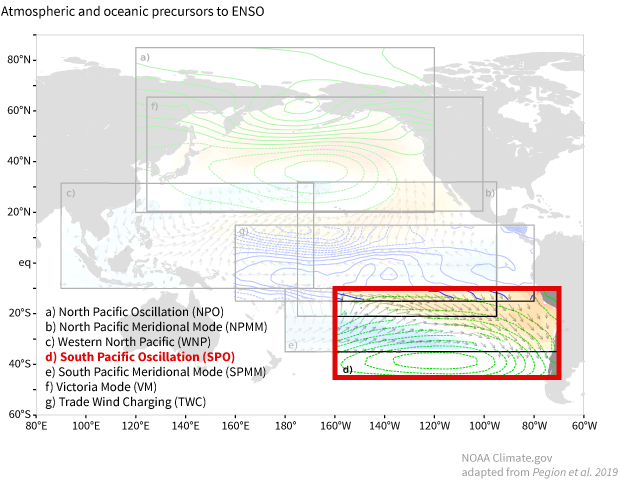
South Pacific Oscillation. Green lines show sea level pressure (solid = stronger than average, dotted = weaker). Figure by climate.gov based on original by Kathy Pegion.
Chimera
In case you can’t tell from the maps, all these patterns overlap and influence each other, as well as providing clues to the development of ENSO. Also, some have alternate names, or have been identified differently by different researchers, and I’m sure if I were to write this post ten years into the future it would be a different animal. Regardless, now you have an idea of some of the many patterns forecasters keep an eye on when on safari developing outlooks for ENSO.
Footnotes
I relied heavily on “Extratropical Precursors of the El Niño-Southern Oscillation” by Kathy Pegion and Chris Selman, published in Climate Extremes: Patterns and Mechanisms, 226 (2017), p.301, for this article. https://doi.org/10.1002/9781119068020.ch18.
(1) The Madden-Julian Oscillation is a debatable application of the word “oscillation,” since it’s a single area of enhanced storminess that travels around the equator. It probably falls into the platypus category.
(2) Why does warmer water weaken the trades in the eastern Pacific, but cooler water weakens them in the western Pacific? The trade winds are the surface component of the Walker circulation. Essentially, the enormous amount of warm water in the far western Pacific and Indonesia leads to lots of rising air in that area, As this air rises, surface level air rushes in to replace it, coming from the eastern Pacific into the west. Anything that slows this circulation slows the trades; cooler water in the western Pacific will reduce the amount of rising air, slowing the surface winds. Tom’s post is essential reading for a full picture of how the Walker circulation works, and how surface temperature affects it.
Comments
What do you think
RE: What do you think
I agree that the "blob" east of New Zealand is very fascinating! Michelle recently wrote a post about similar phenomena in the Northern Hemisphere. I doubt that this hot spot in the Southern Hemisphere will have much effect on ENSO or the large-scale atmospheric circulation, but I presume it will have important local effects on marine life.
Comments have been disabled on this article