The atmosphere and Arctic sea ice: Who’s the dog, and who’s the tail?
In recent years, a popular debate has been occurring within the climate community. No, it’s not whether climate change is occurring and caused by humans. (It is.) Instead, it’s regarding how much of an effect, if any, the rapid warming of Earth’s frozen cake-topper we call the Arctic, and the corresponding reduction in Arctic sea ice, has been having on winter across the mid-latitudes where most of us live.
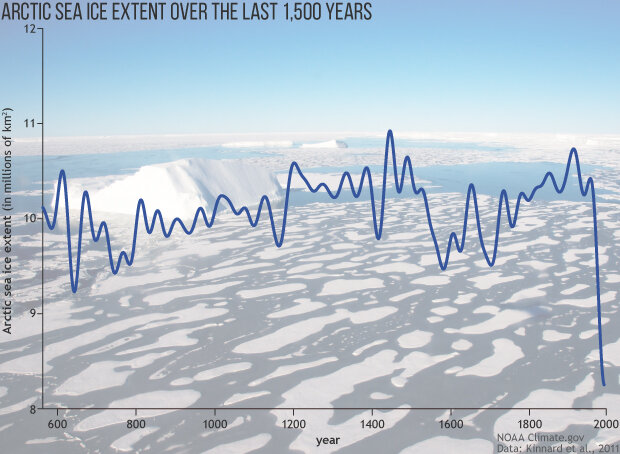
This time series shows the Arctic sea ice extent in millions of square kilometers over the past roughly 1,500 years. The vertical axis starts at 8, not 0, to better show year-to-year variations. Taken from the 2017 issue of NOAA’s Arctic Report Card, scientists report on a body of paleoclimate research that shows that the extent and rate of sea ice decline in the Arctic is unprecedented over at least the past 1,500 years. Climate.gov image adapted from Figure 3 in “Paleoceanographic Perspectives on Arctic Ocean Change” in the 2017 Arctic Report Card. Original data from Kinnard et al., 2011.
The debate arose because, while winters have in general warmed during the last century, some regions have shown a weak cooling trend for certain periods. A cooling trend, from around 1990 through 2013 in landmasses across the mid-latitudes, has been noted in previous research (Cohen et al 2014). It seems these cooling trends have generally weakened or disappeared when data has been updated to the present, but recent winters with bouts of record cold keep the debate alive.
The answer to the debate could have large ramifications for our ability to forecast the winter year in and year out. And I know that is something that concerns all of you, based upon the plethora of winter-related comments you leave on our posts.
In new research from across the pond in England, a team of scientists found that even though a lack of sea ice occurs at the same time as cold mid-latitude winters, it doesn’t cause those cold mid-latitude winters. In scientific jargon-ese, “correlation does NOT mean causation.” The real driver, they say, is an atmospheric circulation pattern across higher latitudes, which drives both low amounts of sea ice and the spilling of cold air into the mid-latitudes. But in order to come to that conclusion, the scientists first had to untangle those multiple, messy climate influencers.
Untangling the options
The difficulty in most investigations of our planet is that a lot of things are influencing the climate all at the same time. It’s like getting your Christmas lights out of the attic and finding two strands of lights hopelessly intertwined. This research, led by Dr. Russell Blackport, first had to untangle those Arctic “lights” in order to see which one is the strand that is “working”, or influencing our mid-latitude winters.
Let’s briefly describe the two influencers at play here and how they could impact mid-latitude winters. First up, a below-average amount of Arctic sea ice. Sea ice is both a reflector and an insulator. When bright, white ice is replaced with the dark ocean in the summer and fall, the surface absorbs more sunlight, and the warmer ocean then warms and moisten the atmosphere above it. This boost of heat and moisture, the thinking goes, can then change the larger atmospheric patterns above the Arctic in winter, which can be the first in a cascade of atmospheric dominos that could potentially lead to impacts across the mid-latitudes.
The second potential influencer is changes in the atmospheric circulation. Circulation changes near the Arctic, even caused by changes as far away as the Tropics, can drive warm moist air into the Arctic and melt/slow the growth of sea ice (Baxter et al. 2019, Clark and Lee, 2019). These same circulation changes could also be simultaneously associated with colder weather in the mid-latitudes.
The critical difference between these two options is the direction heat flows at the surface (1).
Anomalous “bottom up” heat flows (from ocean to atmosphere) would indicate that a lack of sea ice was driving the weather patterns; anomalous “top-down” heat flows would mean the atmosphere was running the show (2). These opposite heat flow patterns gave the scientists a way of testing whether, during winter, the amount of sea ice is driving the atmosphere or the atmosphere is driving the amount of sea ice.
Onto the pretty picture phase.
With a mechanism for sorting out the key players from the chaotic atmosphere determined, it was time for the authors to turn their attention to the full picture. The scientists ran two climate models many times to get a large sample of hypothetical winters, and also examined a dataset of historical observations. These representations of the atmosphere, specifically the sea level pressure and surface air temperature, were then linked to sea ice area in the Chukchi-Bering Sea to create a picture of the atmosphere during high and low amounts of sea ice (3).
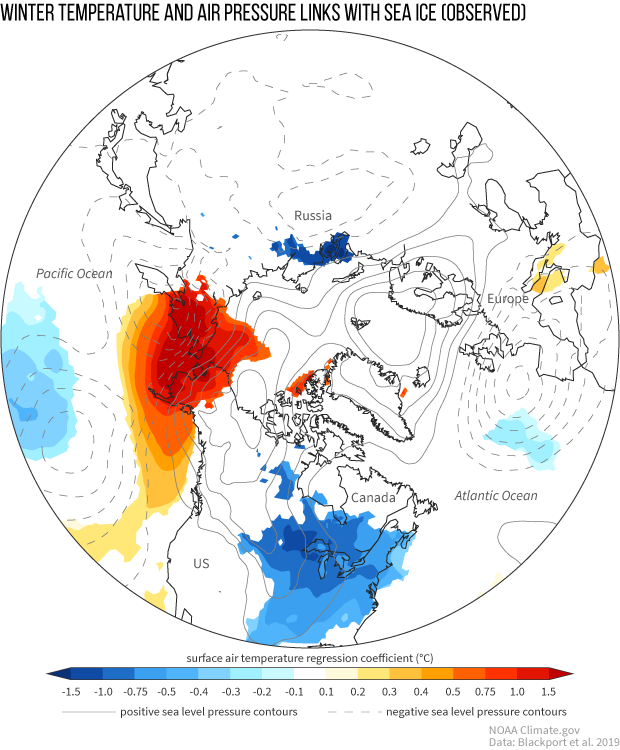
Winter surface temperature (shaded) and sea level pressure (contours) anomalies related to the sea ice area in the Chukchi-Bering Sea using the ERA-Interim observational reanalysis dataset. Reds refer to warmer temperatures and blues refer to colder temperatures. Solid contours represent positive sea level pressure values and dashed contours represent negative. Anomalous winds flow counterclockwise around negative contours and clockwise around positive contours. The image shows that when arctic sea ice is reduced, and warm surface temperature anomalies are present over the Arctic, there is a corresponding cold surface temperature anomalies across North America. Climate.gov image adapted from Blackport et al. 2019.
From the figures, it was very clear that a warm Arctic is strongly linked with cold North American winters via an anomalous cyclonic (counter-clockwise winds) pattern to the west of the Chukchi-Bering Sea and an anti-cyclonic (clockwise winds) pattern to the east. These opposing pressure anomaly patterns result in warmer, moist air being drawn over the Chukchi-Bering Sea and, at the same time, colder Arctic air being funneled south over North America.
But the really interesting thing is what happened when they broke down these winters into just those that corresponded to either sea ice driving the atmosphere (i.e. those with “bottom-up” heat flows) or the atmosphere driving the sea ice (“top-down” heat flows), as determined by the sorting mechanism mentioned earlier.
During winters when sea ice is pushing the atmosphere around, there simply is no cooling over North America, despite there being warming over the Chukchi-Bering Sea. But during winters when the atmosphere is in the driver’s seat, the pattern very closely resembles all of the winters, with both North American cooling and Arctic warming. The lack of a connection in the former sorting suggests that reduced sea ice has only a weak influence on the cold North American winters. More likely, changes in the atmospheric circulation are causing reduced sea ice AND the colder mid-latitude winters. (4)
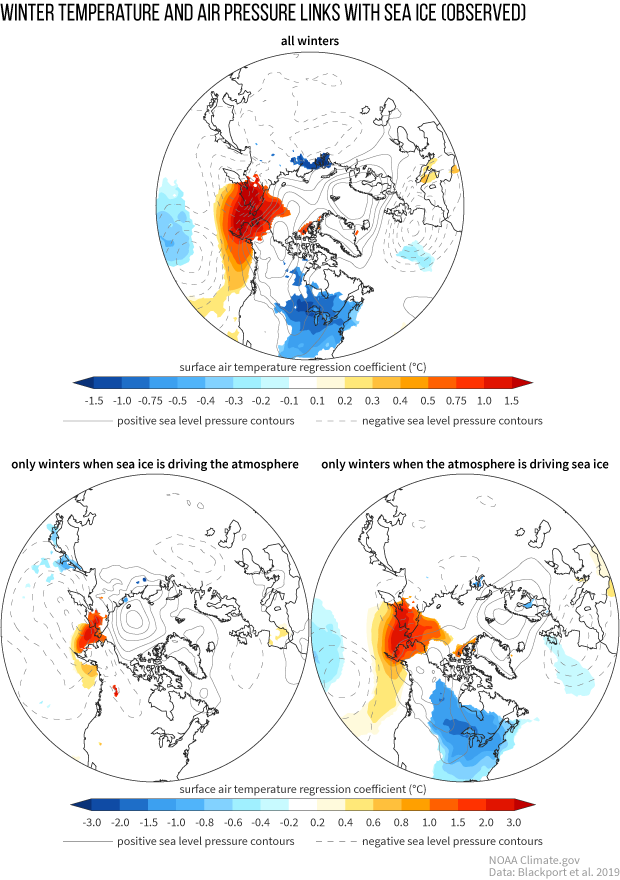
Winter surface temperature (shaded) and sea level pressure (contours) anomalies related to the sea ice area in the Chukchi-Bering Sea using the ERA-Interim observational reanalysis dataset. Reds refer to warmer temperatures and blues refer to colder temperatures. Solid contours represent positive sea level pressure values and dashed contours represent negative. Anomalous winds flow counterclockwise around negative contours and clockwise around positive contours. The top image shows the relationship during all winters. The bottom left image shows the relationship for only those winters where sea ice is driving the atmosphere. The bottom right image shows the relationship for only those winters when the atmosphere is driving the sea ice. The patterns between all winters (top) and when the atmosphere drives the sea ice (bottom right) are the most similar, indicating that the atmosphere is driving cold mid-latitude winters, not the sea ice. Climate.gov image adapted from Blackport et al. 2019.
Forget seasons, what about monthly influences?
But what if sea ice’s influence is stronger on a monthly timescale than a seasonal one? Could a lack of sea ice on a monthly basis kickstart the atmosphere into a pattern that lasts for an entire season? To test this, the authors looked at what happened atmospherically if a month of reduced sea ice was preceded by atmospheric circulation changes or if the month of reduced sea ice came first (5). They came to the same conclusions. One month after reduced sea ice, there was little cooling in North America. Meanwhile, one month before reduced sea ice, there were changes in the atmospheric circulation consistent with cooling in North America, and warming in the Arctic.
The authors suggest that no matter how you cut it, reduced sea ice does not appear to be the main cause of recent cold North American winters. But what about…… THE FUTURE?!
Testing reduced sea ice in climate change scenarios
In one last test, the scientists took a climate model and reduced sea ice to the amounts expected in a world with 2°C of global warming (above the pre-industrial era). This gave the authors the advantage of directly assessing the cause of the impacts in the models (hint, did sea ice do it?), rather than trying to infer it. And once again, with even lower amounts of sea ice in the Chukchi-Bering Sea, a sea-ice driven atmosphere (that is, years in which there were anomalous “bottom-up” heat flows) did not result in colder winter temperatures in the mid-latitudes.
Does this research mean that the disappearance of all of that sea ice is having no influence on the climate whatsoever?
From Dr. Russell Blackport: “Our work suggests that sea ice has minimal influence on the weather in the mid-latitudes, however we still expect sea ice loss to have large impacts locally near where the sea ice is lost. The reduced sea ice and the large warming it causes are already having large impacts on local ecosystems and populations living in the far North. It is also likely that warming caused by sea ice loss near Greenland will contribute to the melting of the Greenland ice sheet, contributing to global sea level rise.”
Thanks to Russell Blackport and James Screen for reviewing this piece and providing the figure.
Footnotes:
(1) This is known as the turbulent heat fluxes and is made up of the sensible and latent heat fluxes. Latent heat flux refers to the energy released or absorbed as water changes phase. And sensible heat flux relates to how heat is transferred due the difference in temperature between the air and the ocean. The heat fluxes derived here are uncertain, but the authors’ analysis only depends on the sign of the heat flux anomaly (whether it is less or greater than the mean), not on the exact magnitude. Because of this, any errors will likely come from years with heat flux anomalies close to 0 being mis-classified. The authors tested this sensitivity of the results to the classification of these years by repeating the analysis using thresholds of +/- 0.5 standard deviations instead of 0. The results were nearly identical.
(2) The scientists’ analysis was based on heat flux anomalies (whether it is more upward or downward than the average). Averaged over the whole winter, the heat flux is always upward in these regions.
(3) The authors used regression analysis between the sea level pressure and surface air temperature, and the Sea Ice Area index of the Chukchi-Bering Sea to create the spatial maps shown in this post. They first did this for all winters, and then reapplied the regression analysis for subsets of all winters that corresponded to a sea-ice driven winter and an atmospheric-circulation driven winter as determined by the direction of the flow of heat at the surface.
(4) This analysis was also done for winters in Asia with similar results. Instead of using sea ice area in the Chukchi-Bering Sea, the Barents-Kara Sea was used. The winter cooling over Asia and the atmospheric circulation that caused it is only evident in winters where the atmosphere was driving reduced sea ice, and not in winters with reduced sea ice driving the atmosphere.
(5) This is called a lead-lag analysis, where temperature and sea level pressure are regressed against the amount of ice in the Chukchi-Bering Sea at -1 month, 0-month and +1 month. By lagging and leading the atmospheric pattern and the sea ice, scientists can investigate what happens if one case is preceded by the other case to determine the influence each option has on each other. In this case, the results once again showed that having a month be preceded by reduced sea ice does not lead to the atmospheric response consistent with what is observed, where temperatures are below-average across the mid-latitude. This response is only evident in cases preceded by a month where the atmospheric circulation is driving sea-ice reductions.
References
Clark, J.P, and S. Lee. The Role of the Tropically Excited Arctic Warming Mechanism on the Warm Arctic Cold Continent Surface Air Temperature Trend Pattern. Geophys. Research Letters, 46, 8490-8499 (2019).
Cohen, J. et al. Recent Arctic amplification and extreme mid-latitude weather. Nature Geosci., 7, 627–637 (2014).
Baxter, I., Q. Ding, A. Schweiger, M. L’Heureux, S. Baxter, T. Wang, Q. Zhang, K. Harnos, B. Markle, D. Topal, and J. Lu. How tropical Pacific surface cooling contributed to accelerated sea ice melt from 2007 to 2012 as ice is thinned by anthropogenic forcing. J. Climate, 0, (2019) https://doi.org/10.1175/JCLI-D-18-0783.1
Blackport, R, J.A. Screen, K. van der Wiel, and R. Bintanja. Minimal influence of reduced Arctic sea ice on coincident cold winters in mid-latitudes. Nature Climate Change, 9, 697-704 (2019).
Comments
More studies please
MJO- SSW connection
RE: MJO- SSW connection
The expressions "bottom-up heat flow" and "top-down heat flow" pertain to whether sea ice is driving the atmosphere (“bottom-up”) or the atmosphere is driving the sea ice (“top-down”). The MJO and SSW are climate patterns, so, while they may influence the atmospheric circulation, the heat flow direction metric used in this study isn't applicable.
Clarification Questions
RE: Clarification Questions
You're right that any trends in winter temperature are very complex! Especially when you take changes in minimum and maximum temperature into consideration. Here are a couple of articles from our sister blog Beyond the Data that discuss climate trends and placing recent cold-air outbreaks in context. In general, the article cited in this post (Cohen et al. 2014) refers to a trend in the average winter temperature from 1990-2014.
More research is needed to identify the changes in atmospheric circulation that are likely driving the Arctic/midlatitude changes. The Arctic Oscillation is an intra-annual mode, meaning it changes on timescales shorter than a year. However, the Arctic Oscillation may be affected by with the circulation changes from global warming... another thing we need more time and research to untangle.
Deep Atlantic Water
The Polar Vortex
Arctic Ice and ENSO
Comments have been disabled on this article