U.S. Climate outlook for January 2022
The calendar has rolled over to the new year and the second month of meteorological winter, and the NOAA Climate Prediction Center has released its outlooks for January 2022 temperature, precipitation, and drought. The dominant pattern for the Lower 48 states is a north-south split in the most likely temperature and precipitation outcomes: cooler- and wetter-than-average conditions across much of the North and warmer and drier conditions across the South. While drought is likely to continue or worsen across much of the West in January, significant improvement is likely across the Pacific Northwest.
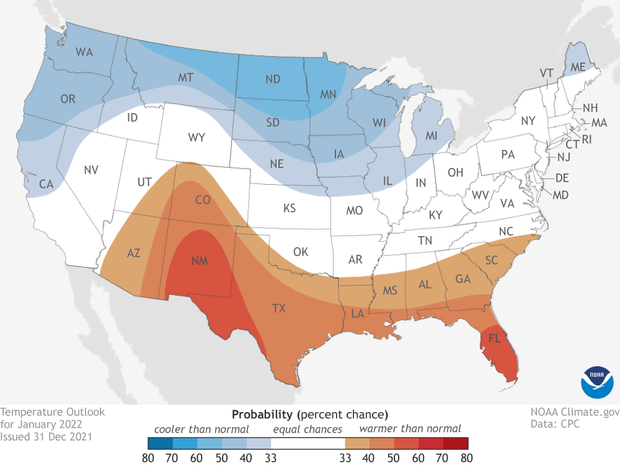
Map of the contiguous United States (view Alaska) showing which of three temperature outcomes—much warmer than average (reds), average, or much cooler than average (blue)—is most likely for the month of January. Darker colors mean greater chances, not bigger temperature extremes. White areas mean a relatively warm, cool, or near-average January are equally likely. NOAA Climate.gov image, based on Climate Prediction Center data.
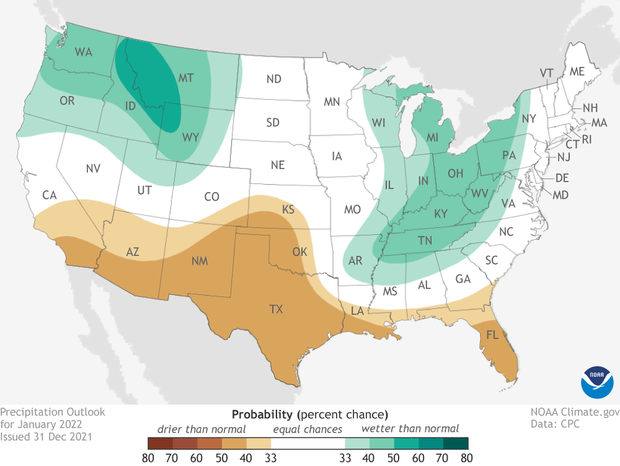
Map of the contiguous United States (view Alaska) showing which of three precipitation outcomes—much wetter than average (greens), average, or much drier than average (browns)—is most likely for the month of January. Darker colors mean greater chances, not bigger precipitation extremes. White areas are places where the odds for a relatively wet, dry, or near-average January are equally likely. NOAA Climate.gov image, based on Climate Prediction Center data.
Cooler-than-average temperatures are favored across the Northern contiguous United States from the West Coast to the central Great Lakes, while warmer-than-average temperatures are favored across the Southwest and Gulf Coast states. A wetter-than-average January is favored in the Pacific Northwest and from the Great Lakes down into the Ohio River Valley. A drier-than-average January is favored across the South. In the Pacific Northwest, the cool-wet combination is likely to improve or even end the drought across parts of Washington, Oregon, northern California, Idaho, western Montana and Wyoming, and northern Utah.
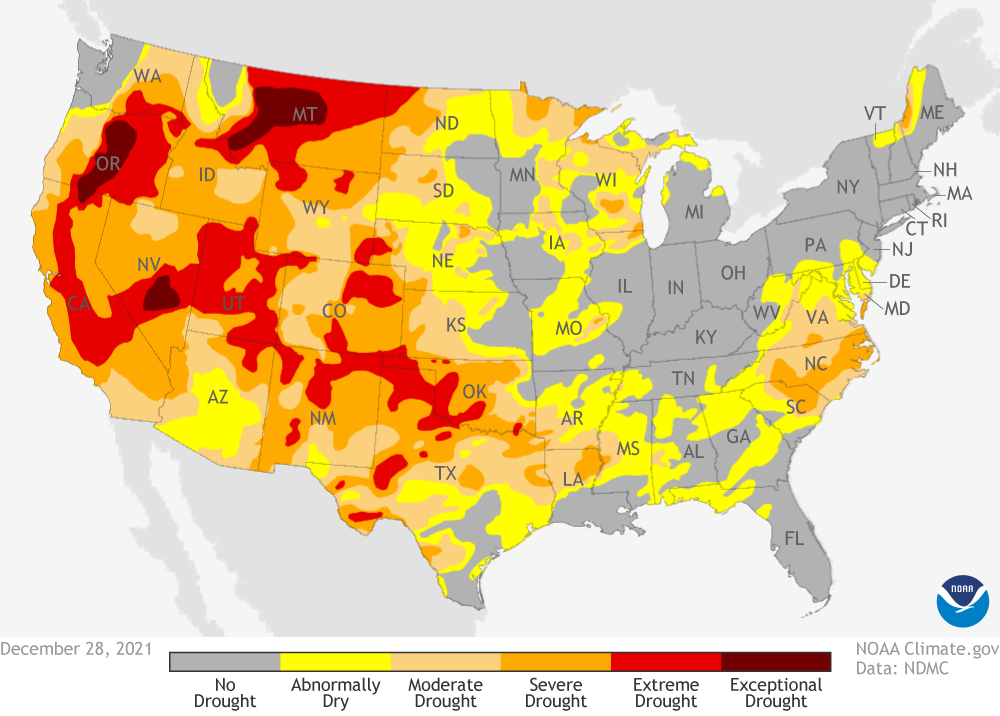
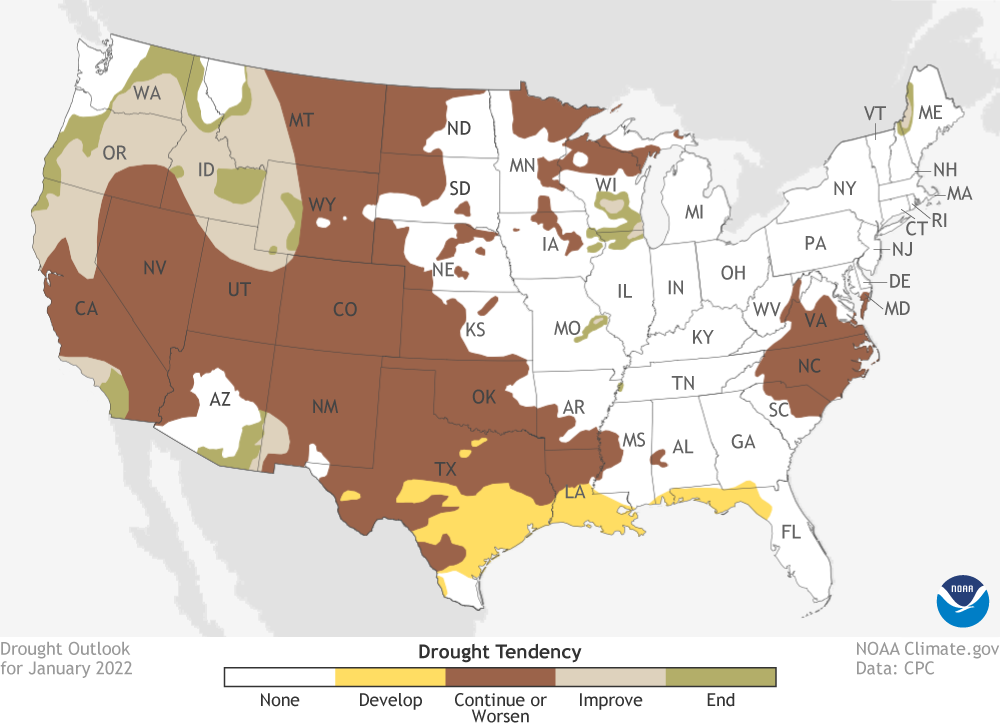
Grab and drag the slider to compare drought status across the contiguous United States as of December 28, 2021 (left), to projected drought conditions in January 2022 (right). The main area of improvement is across the Pacific Northwest. NOAA Climate.gov images, based on data from the U.S. Drought Monitor Project and the Climate Prediction Center.
About the outlooks
The climate outlook maps are not a forecast for the absolute temperature or precipitation amounts in January. Instead, they are the probability (percent chance) that temperatures or precipitation will be in the upper, middle, or lower third of the climatological record (1991-2020) for January. We refer to these categories as “well above,” “well below,” or near average.
Places on the map where experts think that all three outcomes are equally likely are colored white. Colors (red or blue for temperatures, brown or teal for precipitation) indicate that experts think one of the three outcomes is more likely than either of the other two. Darker colors reflect higher chances of a given outcome, not more extreme conditions. Head to the end of this post for more on the math behind the outlooks, including how experts calculate the probability of the less likely (but still possible!) outcomes.
Climate patterns at play
A large influence on the January temperature and climate outlooks is the ongoing La Niña event in the tropical Pacific. La Niña increases the chances for cool and wet winters across the northern tier of the country and warm and dry conditions across the south. That’s the big picture reflected on the maps. Given that fairly reliable connection between La Niña and U.S. winter weather patterns, you might be surprised that the probabilities for those typical climate outcomes aren’t stronger than they are.
It’s important to remember that the ”typical impacts” of El Niño and La Niña are for the winter season (December-February) averages. On shorter time scales, other influences can come into play and weaken La Niña’s grip. Such is the case this month, when the phases of the Madden-Julian Oscillation and the Pacific-North America pattern are poised to undermine some of the typical La Niña impacts at least through the first part of the month, according to the discussion from NOAA Climate Prediction Center.
The Madden-Julian Oscillation, or “MJO” for short, is couplet of weather patterns—a large area of storminess adjacent to a large area of clear, calm weather—that traipses around the tropics every 2-3 months. Think of it like a traveling circus, or a Grateful Dead tour. Whenever the MJO arrives in a particular leg of its round-the-world tour, it tends to disrupt the downstream mid-latitude weather in predictable ways. In late December, the MJO was active in the Western Pacific, which tends to favor cooler-than-average temperatures across most of the contiguous U.S. That would work against the La Niña warming influence in the Southern United States, but strengthen it across parts of the North.
In addition, the Climate Prediction Center notes that the Pacific-North America pattern, which had been in its negative mode through December, is predicted to flip into its positive mode at least through the first half of January, according to climate models. The pressure and jet stream patterns associated with the positive PNA mode tend to oppose the typical climate impacts of La Niña, especially the temperature impacts. The positive PNA mode is associated with cooler-than-average temperatures across much of the South and East, in contrast to La Niña’s warming influence.
These overlapping influences—competing in some cases and reinforcing in others—are among the many factors that forecasters considered when building the January outlook. For more detail, read the full discussion.