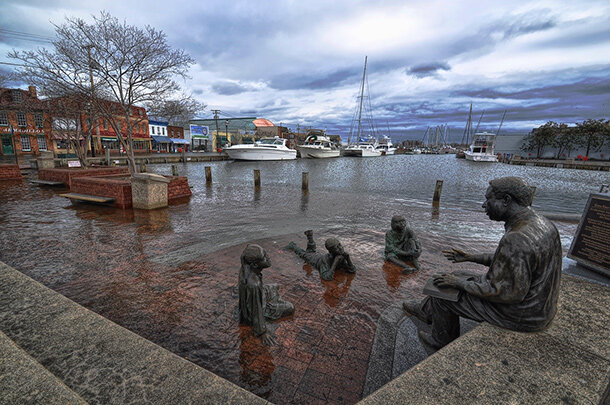
Understanding climate: Billy Sweet and John Marra explain nuisance floods
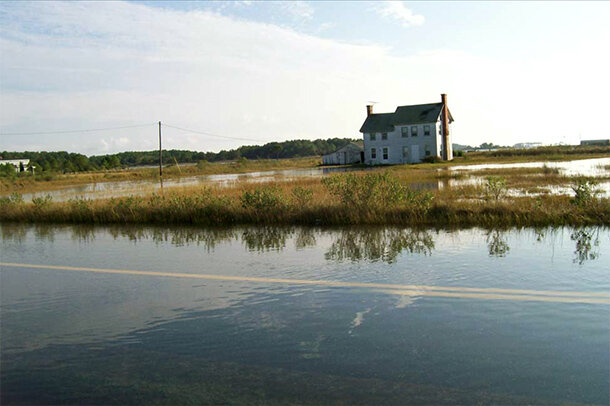
Flooding on Wingate-Bishops Head Road, Eastern Shore, Maryland, during a spring high tide, October 2007. (Photo by Wanda Diane Cole, for Sea Level Rise: Technical Guidance For Dorchester County, a report to the Maryland DNR Coastal Zone Management Division.)
Scientists from NOAA's National Ocean Service have recently completed an analysis of "nuisance flooding" in 27 U.S. cities. Their report includes the number of nuisance flood days each location experienced in 2014, how nuisance flooding has changed since 1950, and how El Niño is likely to boost the number of nuisance flood days for many cities through spring 2016. (press release | full report) In this Q&A, oceanographers Billy Sweet and John Marra explain nuisance flooding and the risks it poses to U.S. cities.
Nuisance flooding is minor, recurrent flooding that takes place at high tide. It occurs when the ocean has reached the "brim" locally. Because of sea level rise, nuisance flooding in the United States has become a "sunny day" event—not necessarily linked to storms or heavy rain.
During nuisance flooding, waves may overtop old seawalls, water may inundate low-lying roads, and storm-water drainage can be diminished. These impacts may not be life threatening, but they disrupt transportation, damage infrastructure, and strain city and county maintenance budgets. A nuisance flood can become a more severe problem if a local rainstorm, storm surge, or wave-overtopping event coincides with high tide.
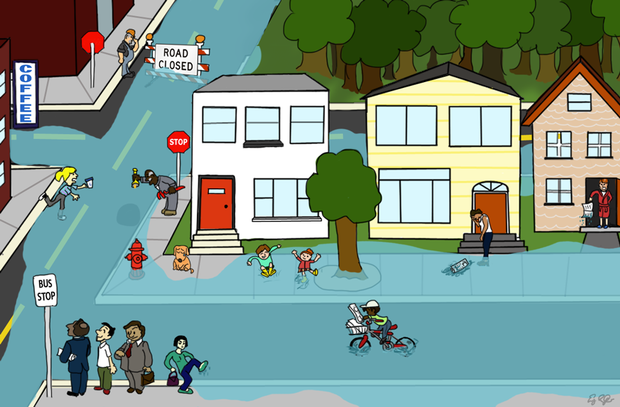
Nuisance flooding impacts may not be life threatening, but they can disrupt transportation, damage infrastructure, and strain city and county maintenance budgets. Due to sea level rise, the frequency of high-tide nuisance floods are rapidly increasing along U.S. coasts. Cartoon by Emily Greenhalgh.
During 2014, nuisance flooding occurred most frequently (> 20 days) along the mid-Atlantic stretch between New Jersey and Georgia. This region typically experiences frequent northeasterly wind events, and the wide continental shelf—a large area of relatively shallow water—allows high water levels to "set up" during storms or from less-noticeable onshore wind forcing.
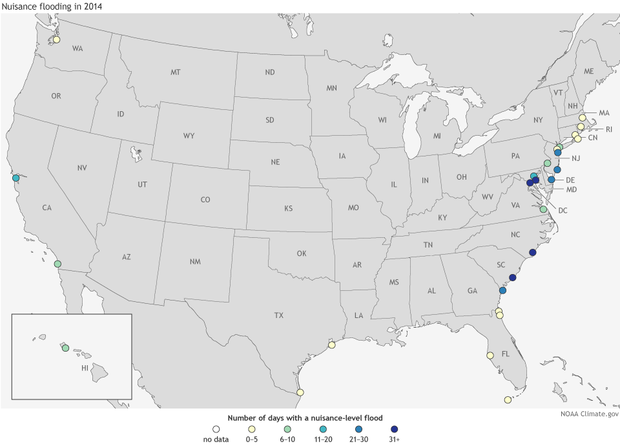
Nuisance flood days observed between May 2014-April 2015. Map by NOAA Climate.gov, based on data provided by Billy Sweet.
The U.S. West Coast and Hawaii also experienced relatively high numbers of nuisance floods, partly due to higher sea levels from unusual ocean warmth and partly due to onshore prevailing wind forcing.
El Niño will likely increase the frequency of nuisance flooding days on both the East and West coasts by anywhere from 25% to 125% compared to the baseline number of days that would be expected based on recent rates and long-term trends.
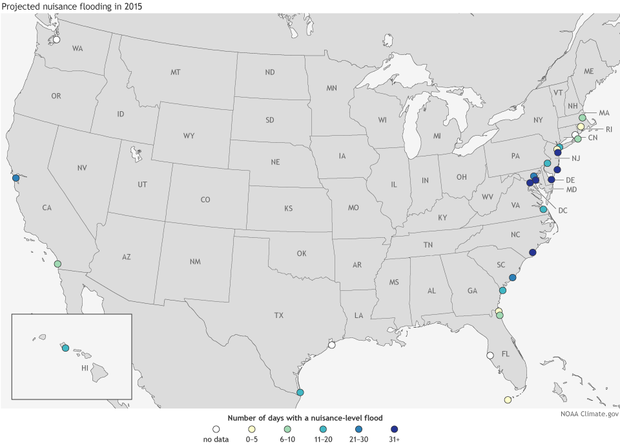
Projected number of nuisance flood days for May 2015-April 2016, based on sea level trends from 1950-2013 combined with influence of El Niño (for locations where historical observations suggests El Niño has an influence on tidal flooding frequency). Map by NOAA Climate.gov, based on data provided by Billy Sweet.
During El Niño, warmer than average surface waters and higher than normal sea levels persist along the U.S. West Coast. These higher sea levels set the stage for typical "king tides" and normal winter storms to have a bigger impact than usual. Along the East Coast, El Niño-related atmospheric "teleconnections" help establish a more zonal (west-to-east) jet stream and storm track, which results in higher-than-normal storm surge frequencies along much of the Mid-Atlantic Coast (see related research by Sweet and Zervas, 2011).
As a result, historically both the West and East Coasts experience more nuisance-level flooding during stronger El Niños.
Taking into account sea level rise and El Niño, we project the following increases in the rate of nuisance floods during 2015 (May 2015–April 2016), compared to baseline levels (what would be expected due to current sea level rise trends): a greater than 25% increase in number of days with nuisance level flooding at Sandy Hook, NJ; Atlantic City, NJ; Baltimore, MD; and Wilmington, NC; a greater than 50% increase at Lewes, DE; Washington, D.C.; and La Jolla, CA; and a 75-125% increase at Montauk, NY; Norfolk (Sewells Point), VA; and San Francisco, CA. El Niño on top of sea level rise could lead to record setting nuisance flood days at Sandy Hook, NJ; Lewes, DE; Washington, DC; and Norfolk, VA.
We define nuisance flooding as occurring when the water level at a NOAA tidal gauge exceeds the local threshold for minor flooding impacts that has been established by the local Weather Forecasting Offices (WFO) of the National Weather Service (NWS). The NWS sets those thresholds through years of flood monitoring.
Nuisance flooding in Annapolis, Maryland, in 2012. Nuisance flooding has increased rapidly along the U.S. Mid-Atlantic Coast. Photo by Amy McGovern.
We report each location's nuisance flood threshold as height above the long-term average of the daily high tide. Some locations have more than one high tide each day; for those locations, the nuisance flood level is reported relative to the average of the higher of the location's high tides.
Nuisance flood thresholds vary by location, and they depend on the surrounding landscape, topography, and infrastructure. In general, however, U.S. infrastructure is vulnerable 1-2' feet above high tide.
For the recent report, we tallied the number of days between May 2014-April 2015 (so as not to split the winter season) that the water level at 27 locations exceeded the local nuisance flood level. We also compared how the observed number of nuisance flood days in 2014 compared to what would be expected based on sea level rise trends in each location. Finally, we project the number of nuisance flood days that we would expect from May 2015-April 2016 based on sea level trends trends alone and with the added influence of El Niño.
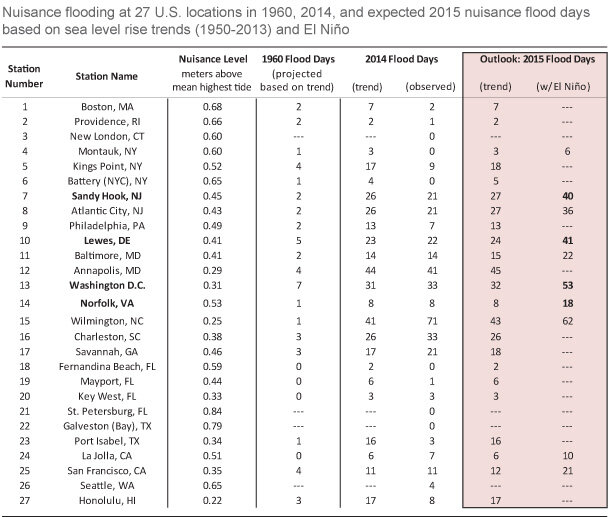
Number of days of nuisance flooding expected in 1960, 2014, and 2015 based on the location's 1950-2013 sea level rise trend and (where there is a connection) El Niño. Locations in bold are projected to experience a record-setting number of nuisance flood days before the end of the May 2015-April 2016 monitoring year.
Along the East and some of the Gulf Coasts, acceleration in annual nuisance flooding is already underway. This implies that once impacts become problematic, they will become chronic rather quickly. There is year-to-year variability about these trends, but on average, annual nuisance flood frequencies have been dramatically increasing.
As relative sea levels rise from land subsidence (sinking and settling of the soil) and rising global ocean levels (due to thermal expansion and ice melt), there is less of a gap between the ocean and our infrastructure. More common tides and storms today are causing impacts, whereas decades ago such impacts would have been more associated with more powerful and rare storms. The NOAA's National Ocean Center offers additional information and resources on nuisance flooding, including an interactive animation of tidal flooding impacts and resilience strategies.
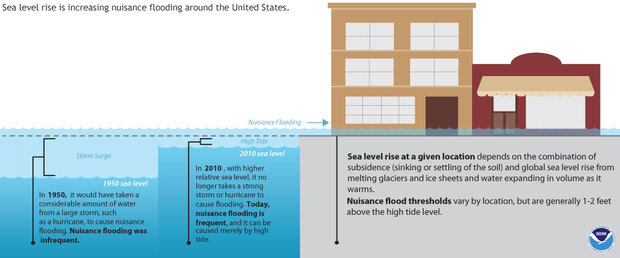
Sea level rise is turning nuisance flooding into a "sunny day" event—high-tide flooding that occurs even without a storm. Graphic adapted from original by NOAA's National Ocean Service.