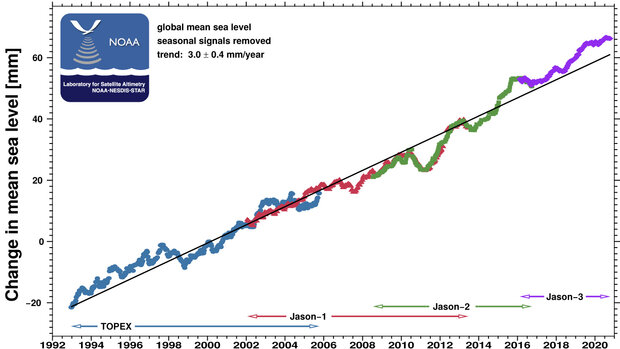
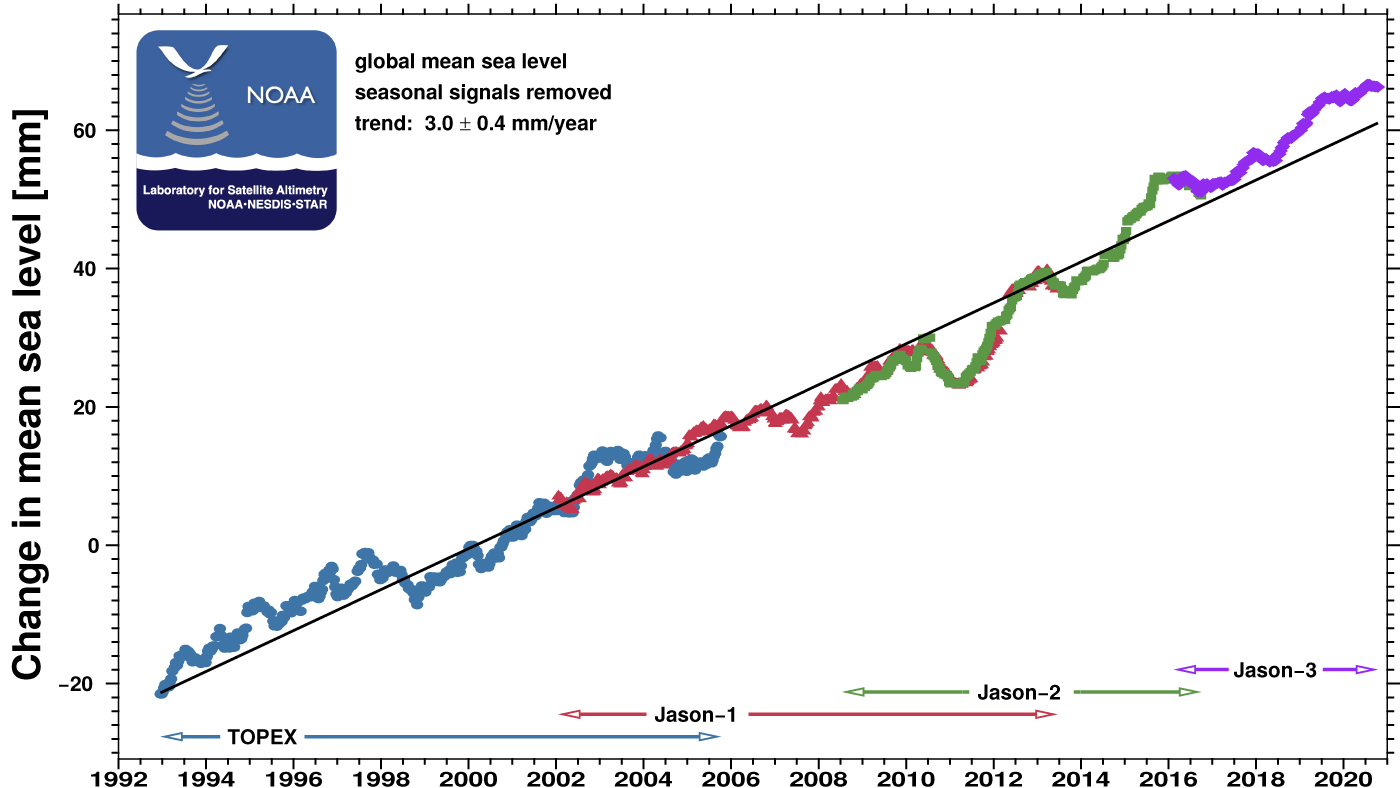
As our planet warms, the ocean’s surface is rising. Water expands as it warms, and melting of ice sheets and glaciers on land adds water to the ocean.
Where do these measurements come from?
Local measurements of sea level change reflect any vertical motion of the land: if land sinks, sea level rises. Conversely, if land moves up, sea level appears to be going down. To remove the motion of land from sea level measurements, sea level is measured by instruments on satelltes. Since 1992, satellite radar altimeters on the series ofTOPEX and Jason satellites have been taking measurements to monitor global mean sea level. The measurements are continuously checked against a network of tide gauges.
-
What can I do with these data?
- Use the average annual rate of sea level rise to estimate the amount sea level has risen in your lifetime.
- If the rate of sea level rise remains constant, how much will it rise in a century?
- Multiply the area of the World Ocean by the average annual rate of sea level rise to estimate the increase in volume of water that occurs each year or decade.
How do I use the site?
- The site displays a current graph of estimated mean sea level.
- Click text links below the map to access the data in a variety of formats.
- Explore the site's Sea Level Trends by Ocean Basin Maps
-
Data Format(s)TXT (ASCII), CSV, netCDF-3, PNG
-
Data TypeMarine / OceanEssential Climate VariablesSea levelScience OrganizationNOAA / NESDIS / STAR Laboratory for Satellite AltimetryEmailhttp://www.star.nesdis.noaa.gov/sod/lsa/personnel.php
 Click to see more detail
