Global climate summary for September 2021
NOAA’s National Centers for Environmental Information is finished rounding up and analyzing all the global weather observations for the past month, and has released the monthly summary for September 2021. According to the analysis, September 2021 was 1.62 degrees Fahrenheit (0.90 degrees Celsius) warmer than the 20th-century average of 59.0 degrees F (15.0 degrees C). It was the fifth-warmest September in the 142-year record, dating back to 1880.
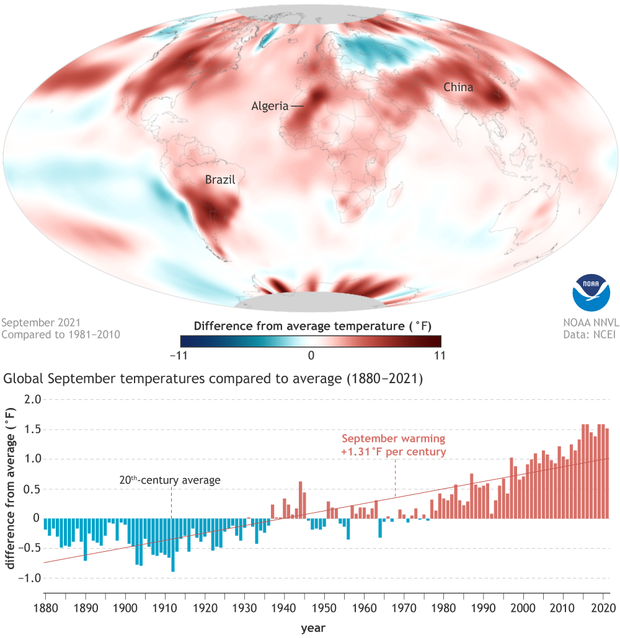
(top) Temperatures in September 2021 compared to the 1981-2010 average. Places where temperatures were warmer than average area red; places where temperatures were cooler than average are blue. (bottom) September temperatures compared to the 20th-century average each year from 1880 to 2021. Blue bars mean cooler-than-average Septembers; red bars mean warmer-than-average Septembers. NOAA Climate.gov image, based on data from NOAA NCEI.
Over land, temperatures were especially warm in southern South America, Northwest Africa, and Southeast China. Over oceans, the tropical South Atlantic was especially warm as were the subtropics of the Pacific in both the Northern and Southern Hemisphere. The broad area of cooler-than-average surface temperatures across the tropical Pacific was a sign that La Niña is back.
Consistent with the planet’s long-term warming trend, nine of the ten warmest Septembers on record have occurred in the past decade. The last time the global average temperature in September was cooler than average was 1976. The long-term warming trend in September is 1.31 degrees F (0.73 degrees C) per century, which means Septembers today are nearly 2 degrees warmer today than they were in 1880.
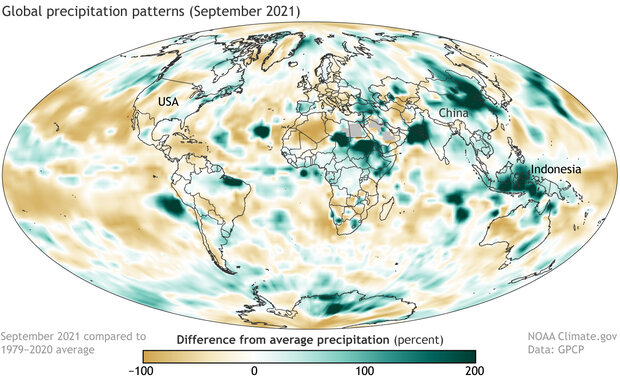
Percent difference from average precipitation in September 2021 compared to the 1979–2020 average. Places where precipitation was up to 100 percent below average are shades of brown; places where precipitation was up to 200 percent above average are blue-green. NOAA Climate.gov image, based on data from the Global Precipitation Climatology Project at University of Maryland.
September was rainier than average over much of India, Southeast Asia, Indonesia and the Maritime Continent, and China. According to the monthly summary from the Global Precipitation Climatology Project,
…it is clear that the summer Asian monsoon, climatologically the strongest precipitation feature on the planet, was particularly intense in September, with above average rainfall over most of South Asia, China and the Maritime Continent. The strong monsoon, with imbedded tropical cyclones, produced intense rain events across the region with flooding in northeast China, Indonesia, Indochina and western India and Pakistan.
For more details and analysis of September 2021 climate, see NCEI’s Assessing the Global Climate in September 2021.