November 2021 was fourth-warmest November on record
NOAA National Centers for Environmental Information released their global climate summary for November 2021, reporting that it was Earth’s fourth-warmest November on record:
The global average temperature over the land and ocean surfaces for November 2021 was 0.91°C (1.64°F) above the 20th century average of 12.9°C (55.2°F), the fourth highest for November since global temperature records began in 1880.
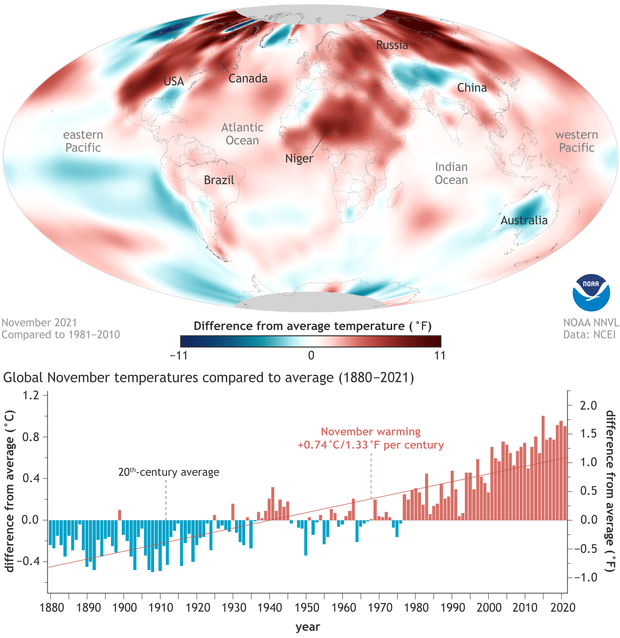
(map) Temperatures across the globe in November 2021 compared to the 1981–2010 average. Northern Hemisphere land areas were especially warm, with temperatures 11 or more degrees Fahrenheit above average in places (darkest reds). In contrast, Australia and western China were cooler than average (blue). (graph) November temperatures compared to the 20th-century average each year from 1880 to 2021. There hasn't been a cooler-than-average November (blue bars) since the mid-1970s. NOAA Climate.gov image, based on data from NOAA NCEI.
According to NCEI’s Climate at a Glance tool, Novembers have warmed at a rate of 1.33 degrees F (0.74 degrees C) per century since 1880. The impact of that trend on the last month of Northern Hemisphere fall is obvious. According to the summary,
The 10 warmest Novembers have occurred since 2004. November 2021 also marks the 45th consecutive November and the 443rd consecutive month with temperatures, at least nominally, above the 20th-century average.
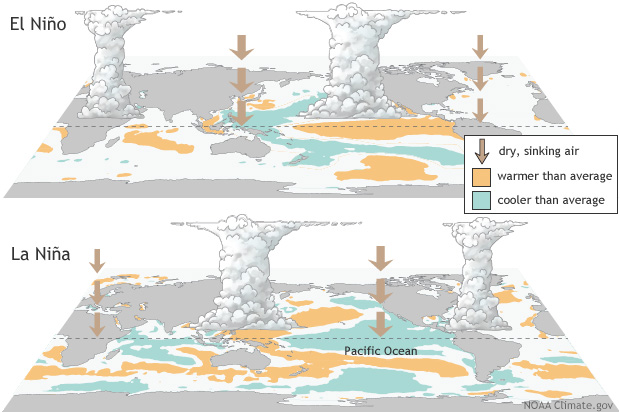
In terms of November precipitation, one of the main highlights of the month was the fingerprints that the La Niña climate pattern left across the tropics: a broad swath of less-than-average rainfall in the central and eastern Pacific and greater-than-average rainfall on either side, in both northern Brazil and northern Australia.
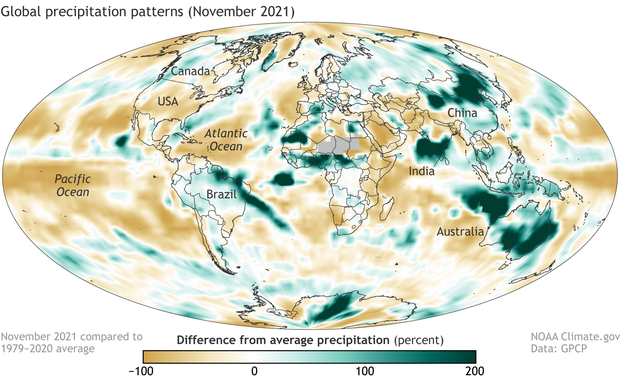
Percent difference from average precipitation in November 2021. Places where precipitation was up to 200 percent above average are green; places where precipitation was as much as 100 percent below average are brown. Map by NOAA Climate.gov, based on data from the Global Precipitation Climatology Project.
Another precipitation highlight was the ribbon of above-average precipitation snaking across the North Pacific between Japan and Canada. According to the report,
This feature is the result of an intense cyclone track across the mid-latitude Pacific with sub-tropical moisture sources resulting associated with multiple Atmospheric Rivers (ARs) hitting the northwest U.S. and Canada's British Columbia during the month, producing flooding and landslides there.
But while the West Coast of North America was getting pummeled by storms, the tropical North Atlantic was remarkable quiet for the last month of the official hurricane season. According to the report, “The dry tropical north Atlantic…is not associated with the La Niña and reflects the almost total lack of tropical cyclones there during November as that storm season ended.”
For more climate highlights for November 2021, browse the full monthly summary from NCEI.