Global climate summary for January 2022
The year is only one full month old, and already statistical predictions from NOAA National Centers for Environmental Information (NCEI) indicate that 2022 is virtually certain to rank among the 10 warmest years on record. According to the Centers’ monthly summary,
The January 2022 global surface temperature was 1.60°F (0.89°C) above the 20th-century average of 53.6°F (12.0°C) and ranked as the sixth-warmest January in the 143-year record. January 2022 also marked the 46th consecutive January and the 445th consecutive month with temperatures, at least nominally, above the 20th-century average.
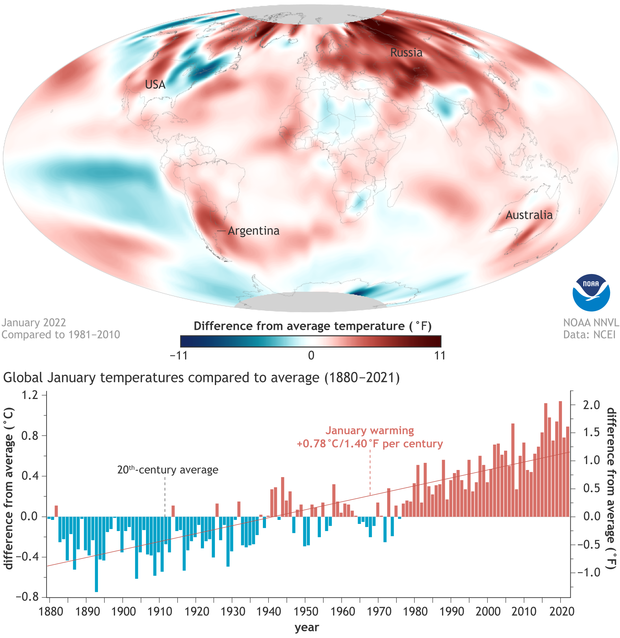
January 2022’s surface temperature compared to the 1981-2010 average. (NOAA’s official map shows January 2022 compared to the 1991-2020 average). Places that were warmer than average are red, including virtually all of western North America, South America, Asia, and Australia. Places that were cooler than average are blue, including India, north-central Africa, and northeastern North America. Map by NOAA Climate.gov, based on data from NOAA NCEI.
Northern North America, the eastern tropical Pacific Ocean (thanks to La Niña), and Northern Africa were the big exceptions to January’s widespread warmth. Meanwhile, most of Asia, Australia, and South America were warmer than average. Including January 2022, the warming trend for January is now 1.4 degrees Fahrenheit (0.78 degrees Celsius) per century. January global temperatures haven't been cooler than the 20th-century average since the mid-1970s.
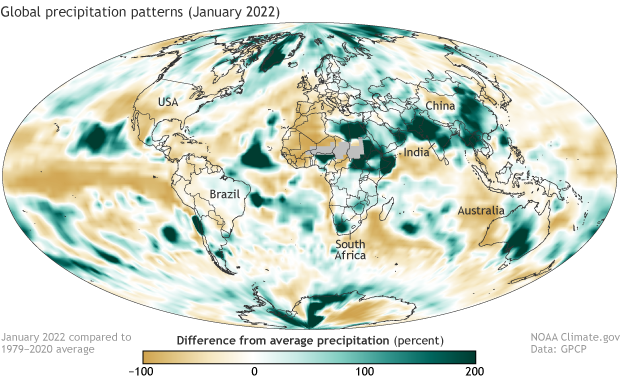
Global map of precipitation in January 2022 as a percent of the 1979-2000 average. Places where precipitation was up to 200 percent more than average are blue-green, while places that were up to 100 percent less than average are brown. Over land, the biggest precipitation shortages relative to the local average were over the U.S South, West Africa, Southern Europe, and Western Australia. Meanwhile, Northeast/East Africa, the Arabian Peninsula, India, Southeast Asia, and eastern China received much more than their average precipitation. Map by NOAA Climate.gov, based on data from the Global Precipitation Climatology Project.
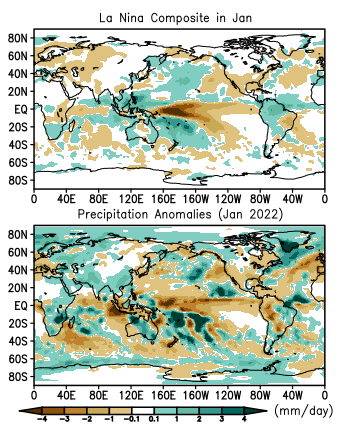
In many ways, the global precipitation patterns in January 2022 were consistent with the typical pattern that accompanies La Niña—the cool phase of the El Niño-Southern Oscillation climate pattern, in the tropical Pacific Ocean. Precipitation was below average across the eastern and central tropical Pacific and above-average in parts of the western Pacific. Below-average precipitation also occurred across the southern tier of the United States.
But precipitation broke the typical La Niña pattern in many areas. A typical La Niña January would bring most of northern South America wetter than average conditions and southeast Brazil drier than average conditions. That pattern was flipped in January 2022. And while it is typical for southern Africa to be wetter than average in January during La Niña, the wetter-than-average pattern this January reached all the way up into tropical East Africa, which is more typically drier than average.
For more details on the January 2022 global climate, including major events, sea ice conditions, and tropical cyclones, check out the global summary and full report for January 2022 from NCEI.